


Debug STM32CubeIDE with PEmicro Cyclone or Multilink
STMicroelectronics' STM32CubeIDE is an Eclipse-based enablement platform that supports code development and debugging on STM32 ARM microprocessors. PEmicro Hardware Interfaces: Multilink and Cyclone can be leveraged for advanced debugging capabilities via an Eclipse GDB plugin available for installation into any Eclipse IDE from the PEmicro update site (http: //www.pemicro.com/eclipse/updates) is freely available. This blog shows the steps required to install and configure PEmicro Multilink and Cyclone debug support in STM32CubeIDE before starting a debug session.
| Installation progress | Frequency |
| 1. Install the PEmicro GDB server for the Arm device plugin | Once Total |
| 2. Create a launch configuration | Once per project |
Installing the PEmicro GDB server for the plugin for ARM devices
a.) Start STM32CubeIDE and proceed with Help -> Install New Software to invoke the plugin installation and update wizard.
b.) Check the GNU ARM PEMicro Interface Debugging Support and PEmicro ARM Device Expansion Plugin checkboxes and click the Next button.
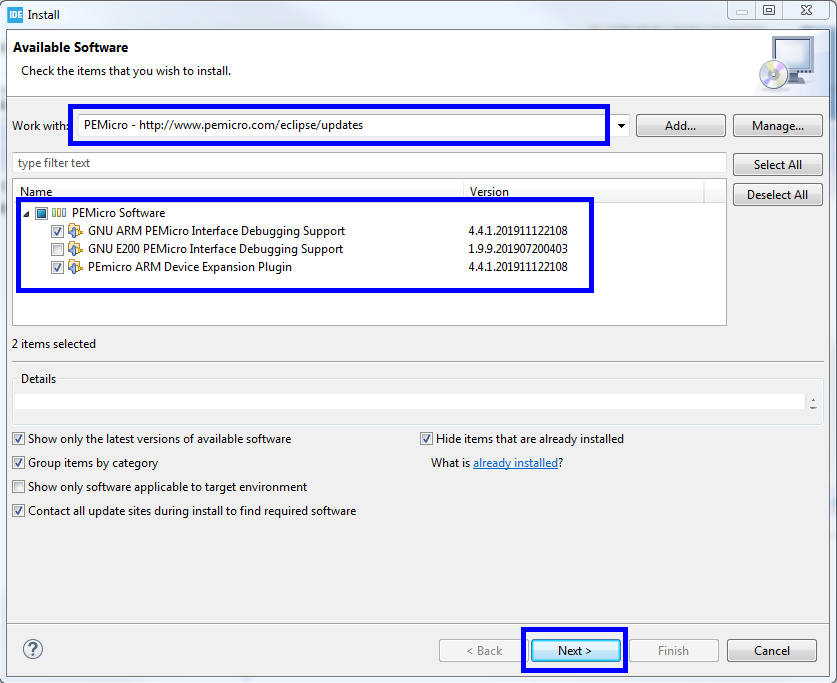
Figure 1. Plugin installation wizard
c.) This will install support for PEmicro's Multilink and Cyclone hardware into STM32CubeIDE. A dialog box appears prompting you to restart STM32CubeIDE. Click Yes.
Start a debug session
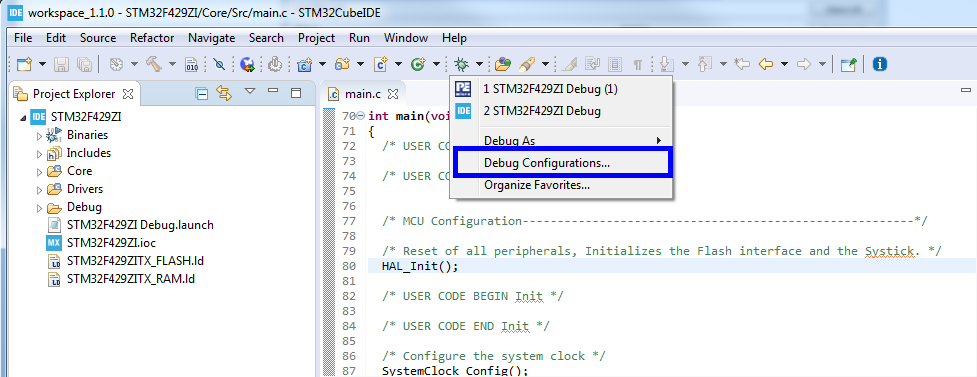
a.) It's incredibly easy to start a debug session from PEmicro's debug probes with STM32CubeIDE. Open a project of your choice and enter the debug configuration manager:
b.) This opens the dialog where the startup settings are configured. PEmicro interfaces require a dedicated boot debug configuration, which can be created first by double-clicking on the GDB PEMicro Interface Debugging category in the left pane.

After the PEmicro boot debug configuration has been created, on the Main tab navigate to a current project as well as a C/C++ application .elf file that you wish to debug.
c.) On the Debug tab, the user may want to change many startup settings to control the following features:
- ITM / Printf / Power measurements via SWO
- exceptional catch
- Automatically supplies/switches power to the target MCU
- Memory area preservation during programming
- The application object files to program and debug
- Any additional object files to be programmed into the device (bootloader, etc.)
- Indicates whether to reset/program a target MCU or connect (hotsync) to a running device
- Semihosting options that allow code to emit debug messages
- Temporary Breakpoints
- MCU device selection
- Debug probe selection via USB or Ethernet
- initialization scripts
For a complete list of features, see the PEmicro plugin documentation (http://www.pemicro.com/downloads/download_file.cfm?download_id=482).
The user should properly configure at least the following settings to start a debugging session:
- Debug the hardware interface
- MCU device part number
- Project and application binary to start with
- A link to the GDB client executable
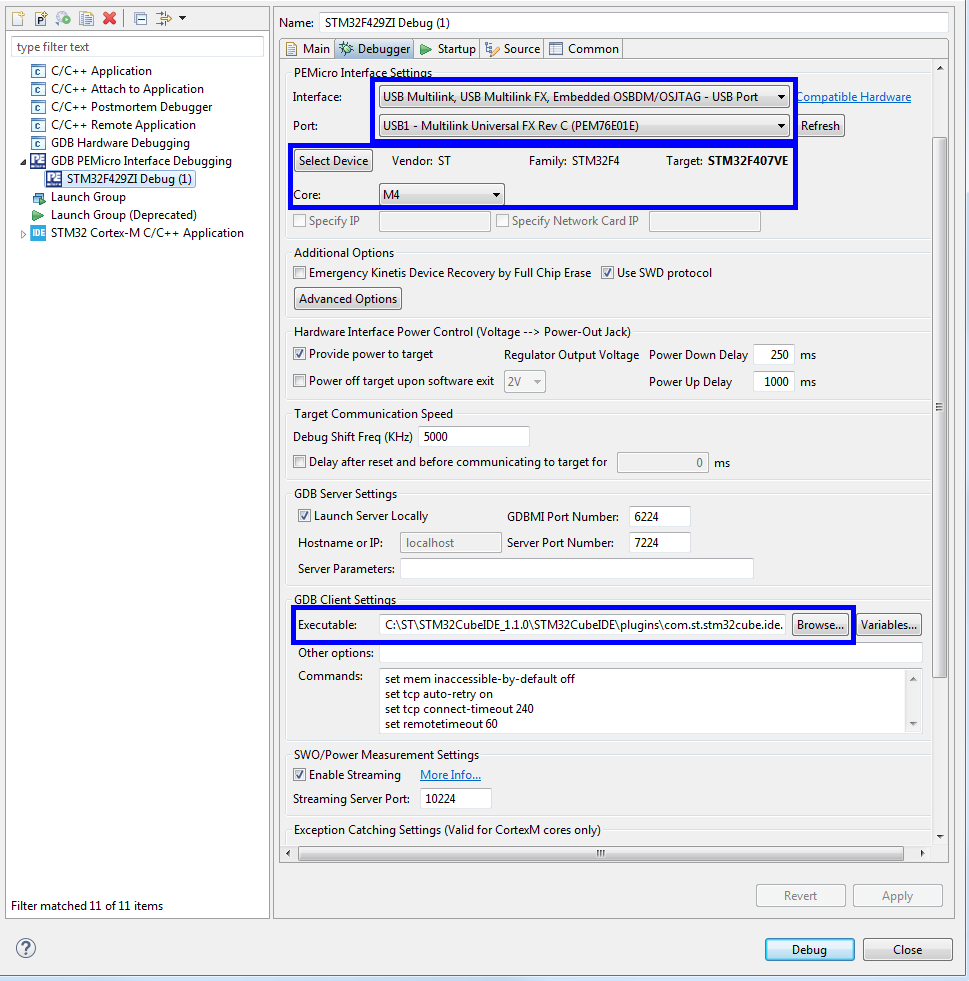
Figure 4. PEmicro debug configuration settings
Wenn eine neue Start-Debug-Konfiguration erstellt wird, sollte der Benutzer zunächst die zu verwendende Debug-Hardwareschnittstelle auswählen. Der PEmicro GDB-Server unterstützt Debug-Verbindungen über die USB Multilink-Debug-Sonden von PEmicro sowie Cyclone-Programmierer über USB und Ethernet.
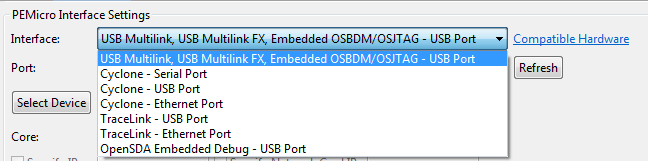
Figure 5. PEmicro debug interface selection
PEmicro's USB and local Ethernet devices are automatically detected. Remote networked Ethernet debug interfaces can be specified by their IP address.
Next, the user should select a specific STM32 MCU device to debug and program.
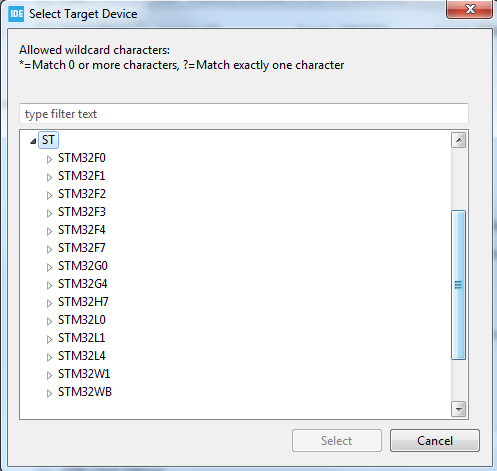
Figure 6. STM32 device tea selection
When creating a new debug configuration, the user should ensure that a path to a GDB client is specified under GDB Client Settings in the debug configuration. STM32CubeIDE comes with a preinstalled GNU plugin for external tools: com.st.stm32cube.ide.mcu.externaltools.gnu-tools-for-stm32.7-2018-q2-update.win32_1.0.0.201904181610. Therefore, point to the GDB Client Setting text box with a direct path to the arm-none-eabi-gdb.exe client. Please note that the actual path depends on the version of the plugin as well as the location of your STM32Cube installation directory (STM32CubeIDE\plugins\com.st.stm32cube.ide.mcu.externaltools.gnu-tools-for-stm32) may vary. 7-2018-q2-update.win32_1.0.0.201904181610\tools\bin\arm-none-eabi-gdb.exe).
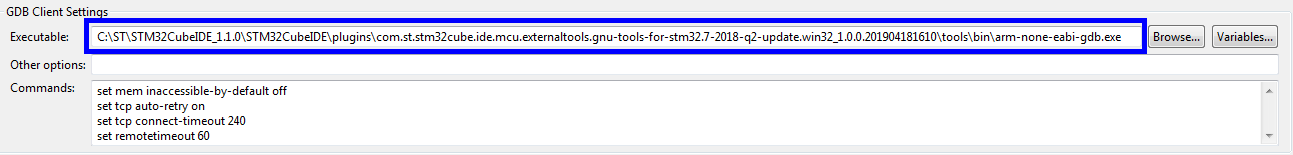
Figure 7. GDB Client Path
Once these debug settings are complete, a debug session can be started by pressing the debug button.
PEmicro's Eclipse-based GDB Server Plugin allows developers to use PEmicro's Multicink and Cyclone interfaces to program and debug ARM and PowerPC processors in a wide variety of Eclipse-based IDEs . PEmicro Eclipse GDB Plugins for ARM and PowerPC devices provide the ability to quickly develop and debug code for STM32 ARM and SPC5 ST PowerPC devices.
Cyclone und Multilink Interface


