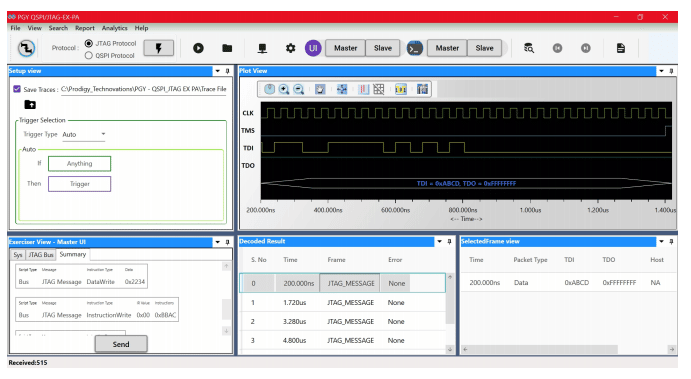
Protocol Analyzer & Logger

Compared to an oscilloscope, a protocol analyzer offers the advantage of being able to record large amounts of data in real time and to display the bit stream decoded in plain text such as hex. However, if the physical waveform is to be recorded and viewed, the use of a oscilloscope is recommended. We offer the widest range of protocol analysis solutions for monitoring data transmissions on various bus networks. Below are some of the supported protocols.
CAN
The Controller Area Network (CAN) bus was developed by Bosch in 1983 and presented in 1986 together with Intel. The goal when creating it was to reduce cable harnesses in order to save costs and weight and to enable faster communication between electronic components. At that time, the total length of all cables in vehicles without CAN could be up to 2 km. Today it is indispensable in the automotive sector and has become a common standard. Due to the many advantages with regard to conventional communication protocols, the CAN bus is also used in the fields of automation, building services, military or even in medical electronics.
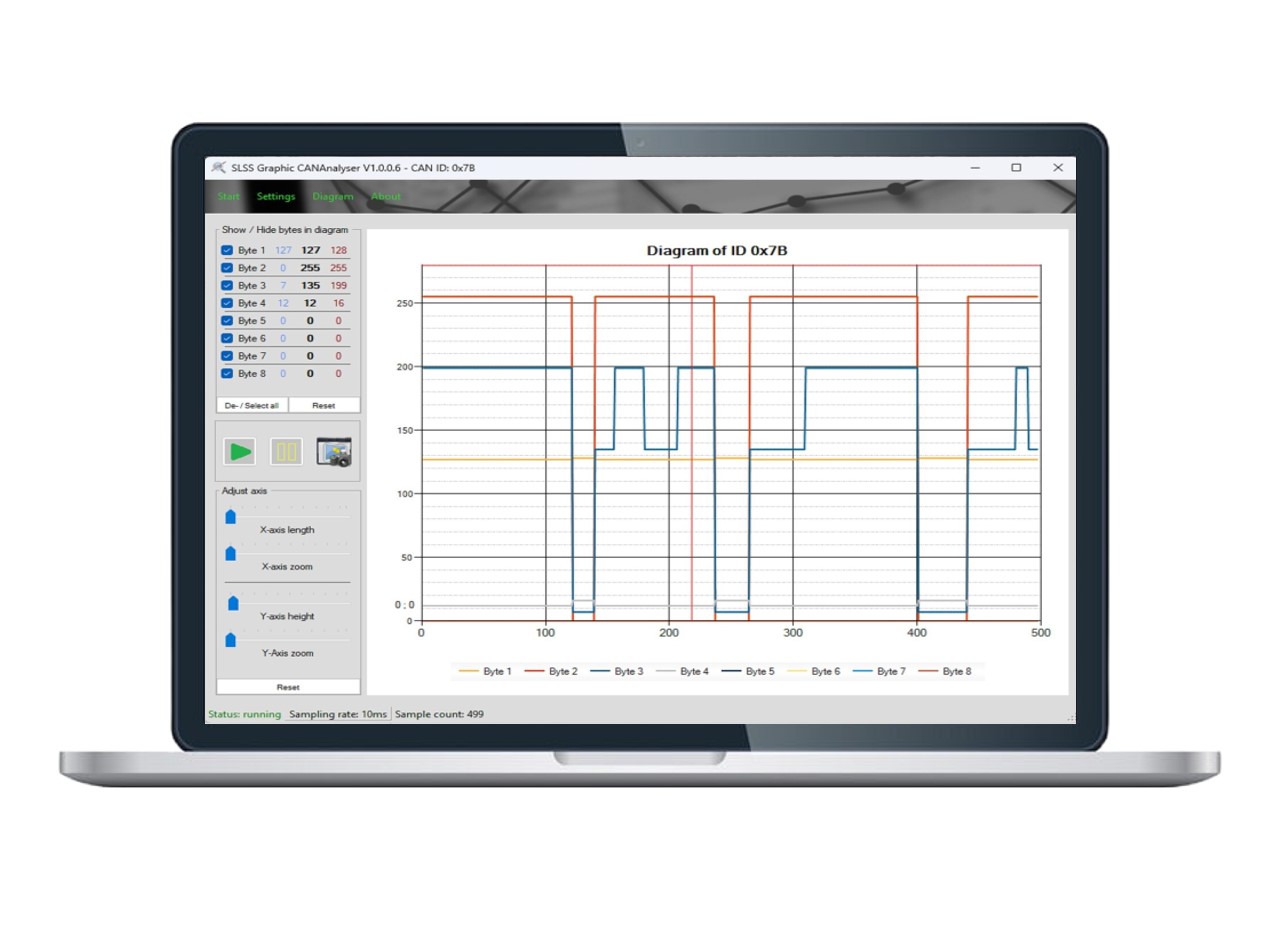
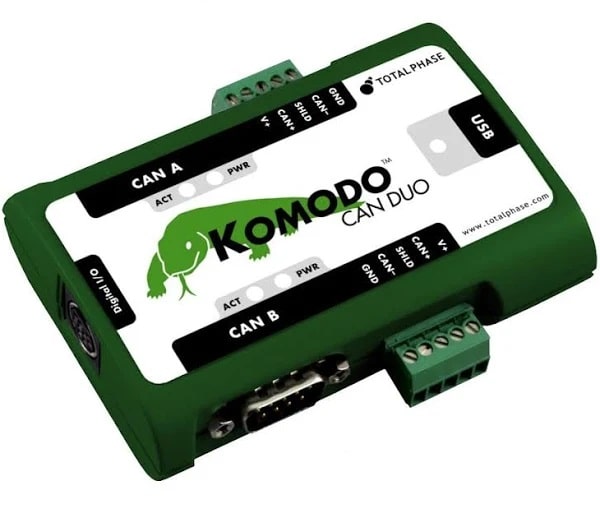
When developing and debugging with the Controller Area Network Bus, it is often necessary to send test transmissions or to identify errors and their origin as quickly as possible in order to correct them as quickly as possible. A CAN bus adapter is often the best solution here to get full access to the CAN bus network and to carry out distortion-free monitoring.
eMMC
An eMMC (embedded Multi Media Card) is an energy and space-saving storage medium specified by JEDEC, based on the MMC standard, which was developed for use as internal data storage in mobile devices. In terms of performance, this memory is comparable to an SD card and is therefore installed in compact end devices. Since the eMMC is bootable, this storage medium is also suitable for operating systems such as Android, Chrome OS, iOS or Windows. The memory size ranged up to 256 GB in 2017. eMMC, especially in smartphones, are increasingly being replaced by UFS, which achieve significantly higher write and read speeds.
The Prodigy eMMC Protocol Analyzer is a multifunctional solution for capturing and debugging the communication between the host and the memory under test. It is the first eMMC protocol analyzer in the industry to support the 4.41, 4.5.1, 5.0 and 5.1 specifications.
eSPI
The Enhanced Serial Peripheral Interface (eSPI) developed by Intel was developed as a replacement for the LPC (Low Pin Count) bus. The advantages of the eSPI include the number of pins required, the higher data throughput, the lower working voltage (1.8V) and the shared use of SPI flash devices. These advantages enable a smaller process chain in chip manufacture. In addition, eSPI enables system designers to make early cost and performance assessments of their system. eSPI uses the physical interface designed for SPI, including the master-multi-slave topology.
Our eSPI protocol analysis solution enables you to monitor the communication between a master and multiple slaves on the data lines. The eSPI example data can be used to simulate an eSPI master.
I2C
The Inter-Integrated Circuit (I2C / I2C) bus is a serial data bus developed by Philips Semiconductors. It is mainly used inside the device for communication between different circuit parts, e.g. B. between a controller and peripheral ICs.
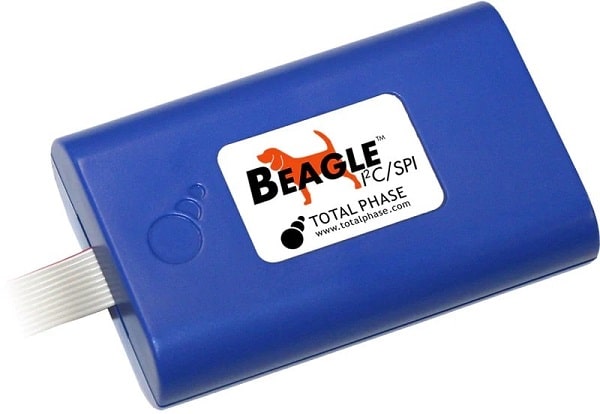
With the Beagle I2C / SPI protocol analyzer, data traffic can be easily debugged and monitored using suitable protocol analysis software (data center).
I3C
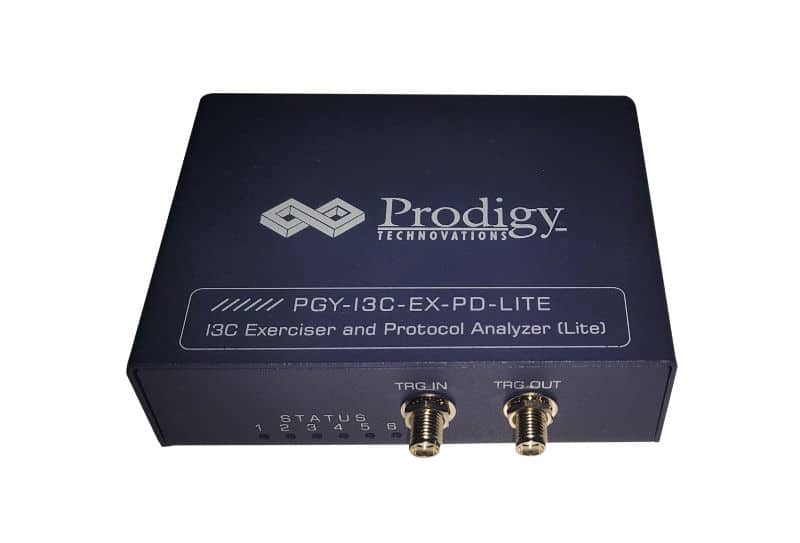
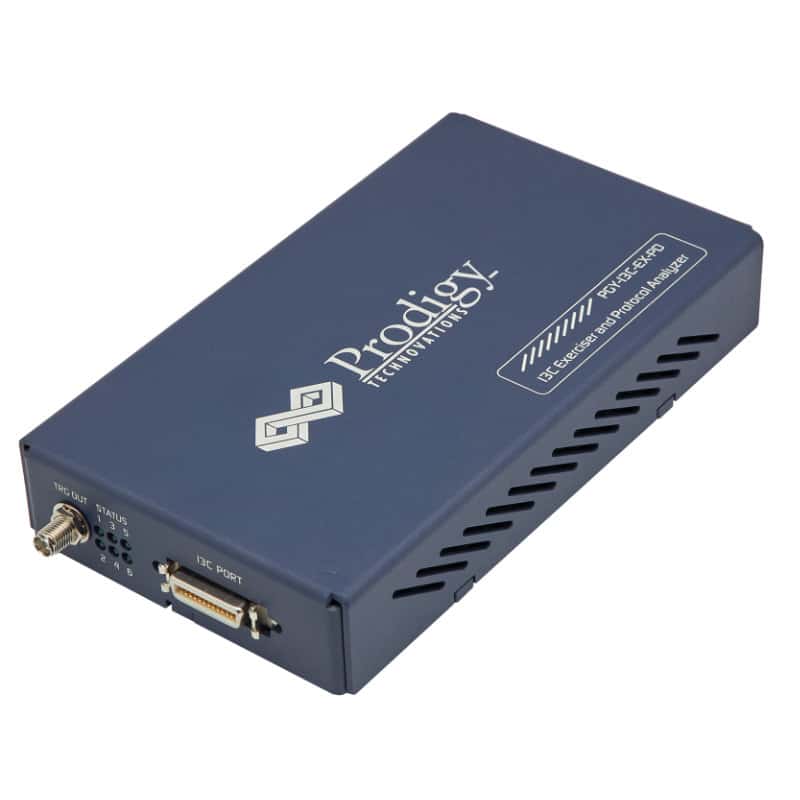
The PGY-I3C-EX-PD series is the world's leading solution for testing I3C designs. The devices of the PGY-I3C-EX-PD series can be configured as master or slave, generate the I3C data traffic with error injections and decode the packets of the I3C protocol.
The Prodigy I3C Analyzer and Exerciser series includes a Lite version and a Full version with full functionality and maximum hardware performance.
RFFE interface
Originally released in July 2010Released MIPI RFFE SM , the MIPI RF Front-End Control Interface , is the world's de facto standardized interface for controlling radio frequency front-end (FE) subsystems. It provides fast, agile, semi-automated and comprehensive control of the complex RF subsystem environment that has stringent performance requirements and includes up to 19 components per bus instance (up to 15 slave devices and up to four master devices). Power supplies can include amplifiers, LNAs, antenna tuners, filters and switches.
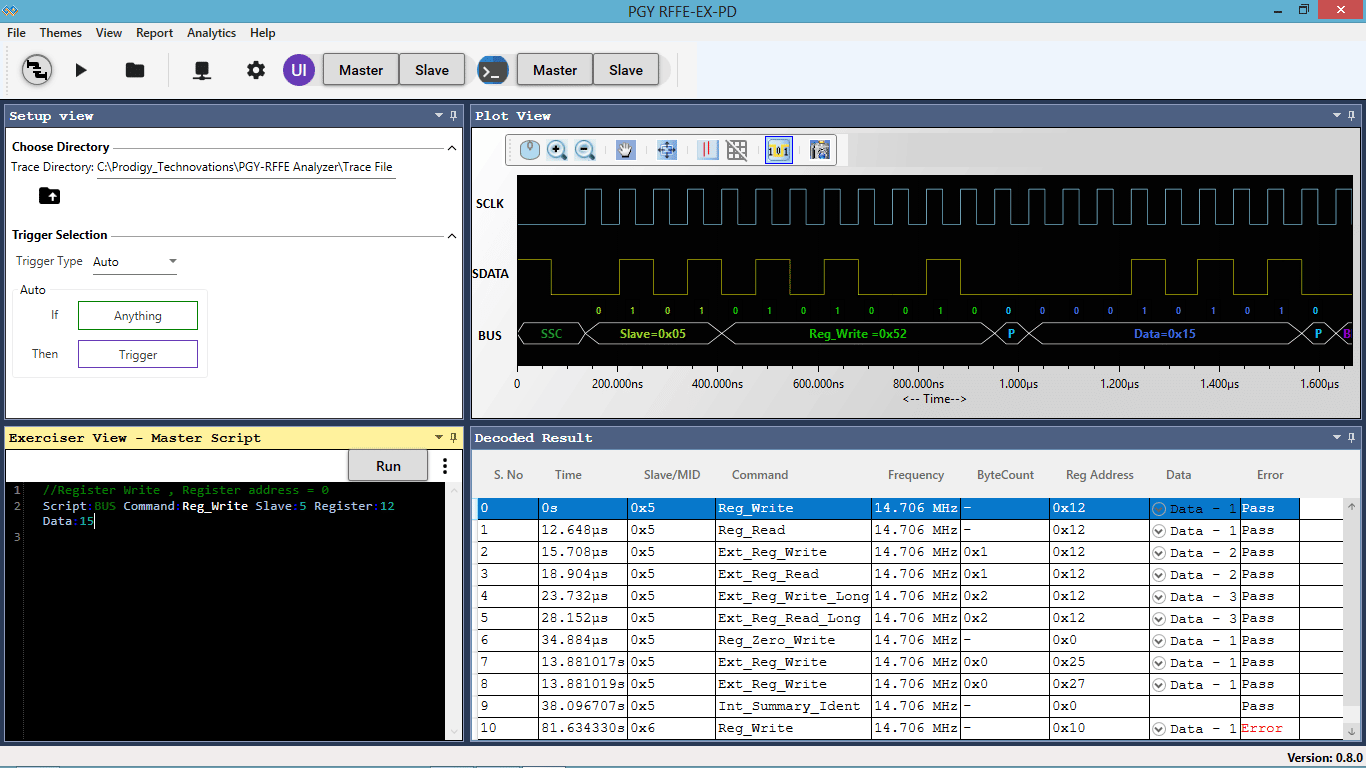
Prodigy's RFFE Protocol Analyzer is the ideal tool for design and test engineers to test the RFFE interface against their specifications. The device can be configured both as a master and as a slave, in order to enable the generation of RFFE traffic with error injections, amplitude variation and decoding of the RFFE protocol packets in addition to the protocol analysis.
SD
Secure Digital , officially abbreviated as SD , is a proprietary non-volatile memory card format developed by the SD Card Association (SDA) for use in portable devices. The Secure Digital Input Output (SDIO) is an extension of the SD specification to cover I/O functions. SDIO cards are only fully functional in host devices that support their input/output capabilities (usually PDAs like the Palm Treo, but occasionally laptops or cell phones). These devices can use the SD slot to support GPS receivers, modems, barcode readers, FM radio tuners, TV tuners, RFID readers, digital cameras and interfaces Use Wi-Fi , Bluetooth , Ethernet and IrDA. Many other SDIO devices have been proposed, but it is now more common for I/O devices to connect via the USB interface. SDIO cards support most SD card storage commands. Prodigy Technovations protocol analyzers enable development and verification engineers to test and debug SD as well as SDIO by targeting Command, Response, Data or to Trigger CRC error.
SPI
The Serial Peripheral Interface (SPI) is a bus system developed by Motorola (now NXP Semiconductors) in 1987 and represents a standard for a synchronous serial data bus (Synchronous Serial Port) with which digital circuits can be connected to each other according to the master-slave principle. The Beagle SPI Protocol Analyzer enables the entire bus data traffic to be monitored and can be operated intuitively with the appropriate analysis software (Data Center).
USB
USB was introduced in 1996 as USB 1.0 with a maximum data rate of 12 Mbit/s. In the year 2000, version USB 2.0 was specified, with 480 Mbit/s still the most common version today. With the USB 3.0 standard introduced in 2008, the maximum gross data transfer rate for SuperSpeed is 5 Gbit/s. Even with USB 1.0, it was possible to supply power to connected devices via the USB cable connections. Due to the greatly increased possible power consumption, verification of the embedded system is now necessary. Our solutions enable you to monitor the data traffic as well as the voltage and power supply on the USB bus.
UFS
In 2011 the first standard version of UFS was released. There are now 6 different versions of UFS that achieve a maximum data transfer speed of up to 1450 MB/s, which is three times the data transfer speed of the fastest modern eMMC’s. With our solutions for UFS, in addition to the acquisition and debugging of MPHY, UniPRO and UFS, the immediate decoding of UFS layers, UniPRO layers and MPHY layers is possible.

Main properties
- Monitor I2C non-intrusively up to 4MHz
- Non-intrusive monitoring of SPI up to 24MHz †
- Non-intrusive monitoring of MDIO up to 2.5MHz (Clause 22 and Clause 45) ‡
- Real-time data acquisition and display - observe I2C and SPI packets as they occur on the bus.
- Bit-level timing with up to 20 ns resolution.
- Fully compatible with Windows, Linux and Mac OS X
- Includes full feature monitoring tools

Main properties
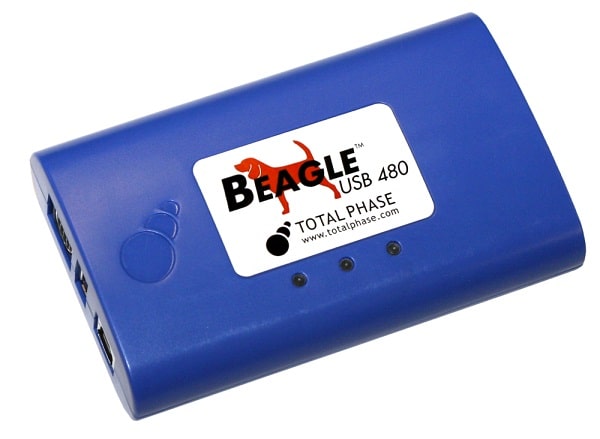
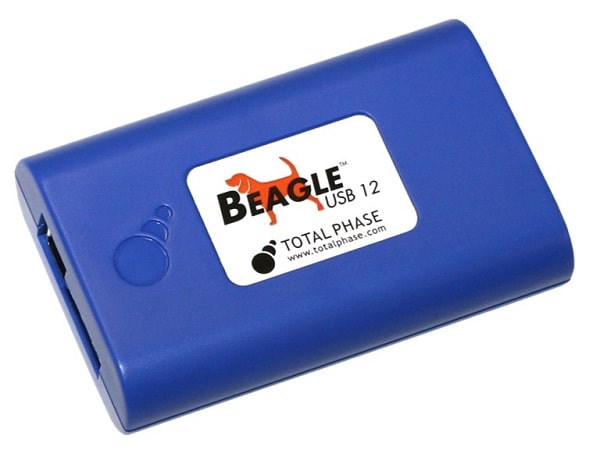
- Non-intrusive monitoring of high-speed USB 2.0 (up to 480 Mbit/s)
- Real-time USB class level decoding with Data Center Software
- Two recording modes: real time and delayed download
- High speed USB chip detection
- Robust automatic speed detection
- Hardware based packet suppression
- Digital inputs and outputs for synchronization with external logic
- Detect suspend/resume events and unexpected signals
- Free software and API available
- Fully compatible with Windows, Linux and Mac OS X

Current/Voltage Monitor
- Graphing real-time VBUS current and voltage readings
- Interactive and bi-directional correlation of current/voltage values with USB data
High performance hardware buffer
- 256MB capacity
- Large ring buffer
Real-time USB class level decoding
- HID, Audio, Video, Still, Printer
- Storage, Hub
- Network, Mobile, CDC

Key Features
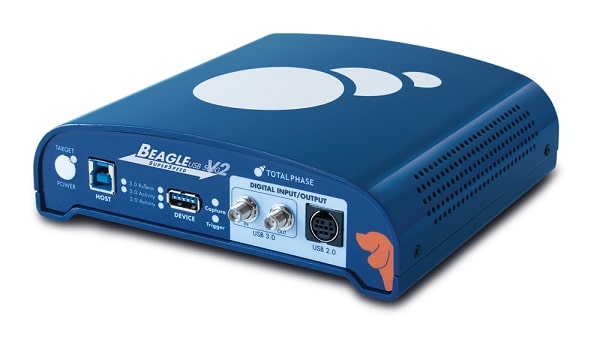
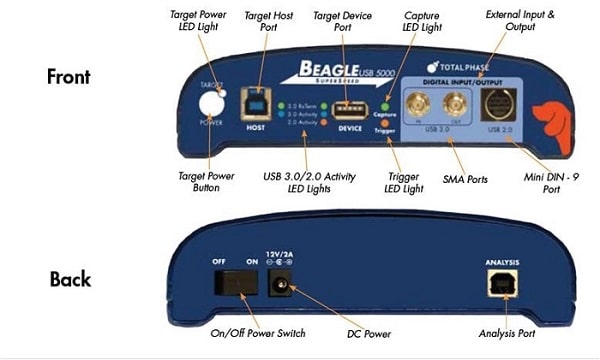
- Monitor USB 3.0 and USB 2.0 simultaneously without intervention
- 4GB on-board buffer with live data streaming to analysis computer
- Real-time USB class level decoding with Data Center Software
- Precise timing up to a resolution of 2 ns
- Match/Action trigger and filter system
- Hardware-based USB 2.0 and 3.0 packet suppression
- USB 3.0 downlink enables longer recordings
- Enable advanced synchronization to monitor applications that require multiple analyzers
- Automatic support for data encryption, spread spectrum clocking, polarity reversal and receiver detection
- Multiple digital inputs and outputs for synchronization with external devices
- Fully compatible with Windows, Linux and Mac OS X with support for 32 and 64-bit systems
Hardware requirement
- Intel or AMD processor operating at 2 gigahertz (GHz) or faster
- 1 gigabyte (GB) physical RAM (32-bit) or 2 GB RAM (64-bit)
- 2 GB or more free disk space
- Full-speed USB interface
- Screen resolution of 1024x768 or better
- Internet connection is helpfuldus.

Hardware requirement
- Intel or AMD 2 GHz processor or faster
- 1 gigabyte (GB) of physical RAM (32-bit) or 2 GB of RAM (64-bit)
- 2 GB or more available disk space
- High Speed USB Port
- VGA suitable for a screen resolution of 1024 x 768 or higher
- Internet access is helpful
Supported operating systems (32-bit and 64-bit)
- Windows: 7, 8, 8.1, 10
- Linux: Red Hat, SuSE, Ubuntu, Fedora, Arch, CentOS, Debian
- Mac OS X: 10.5-10.10

Main properties
- Dual channel: two independent adaptable CAN channels
- Transfer rate up to 1 Mbit/s
- Independent galvanic isolation per CAN channel
- 8 configurable GPIOs
- USB 2.0 full speed; bus powered
- Free software and API
- Cross-platform support: Compatible with Windows, Linux and Mac OS X

Features I3C Protocol Analyzer und Exerciser
*v1.1 supports only one lane commands
Price on request
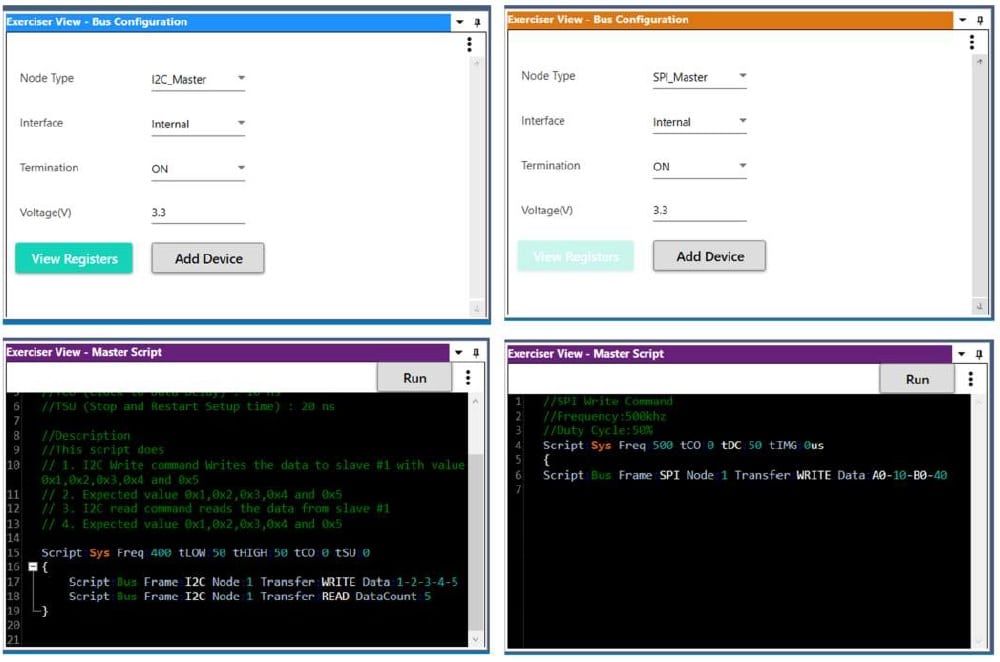
Features I3C Protocol Analyzer und Exerciser
*v1.1 supports only one lane commands
Price on request

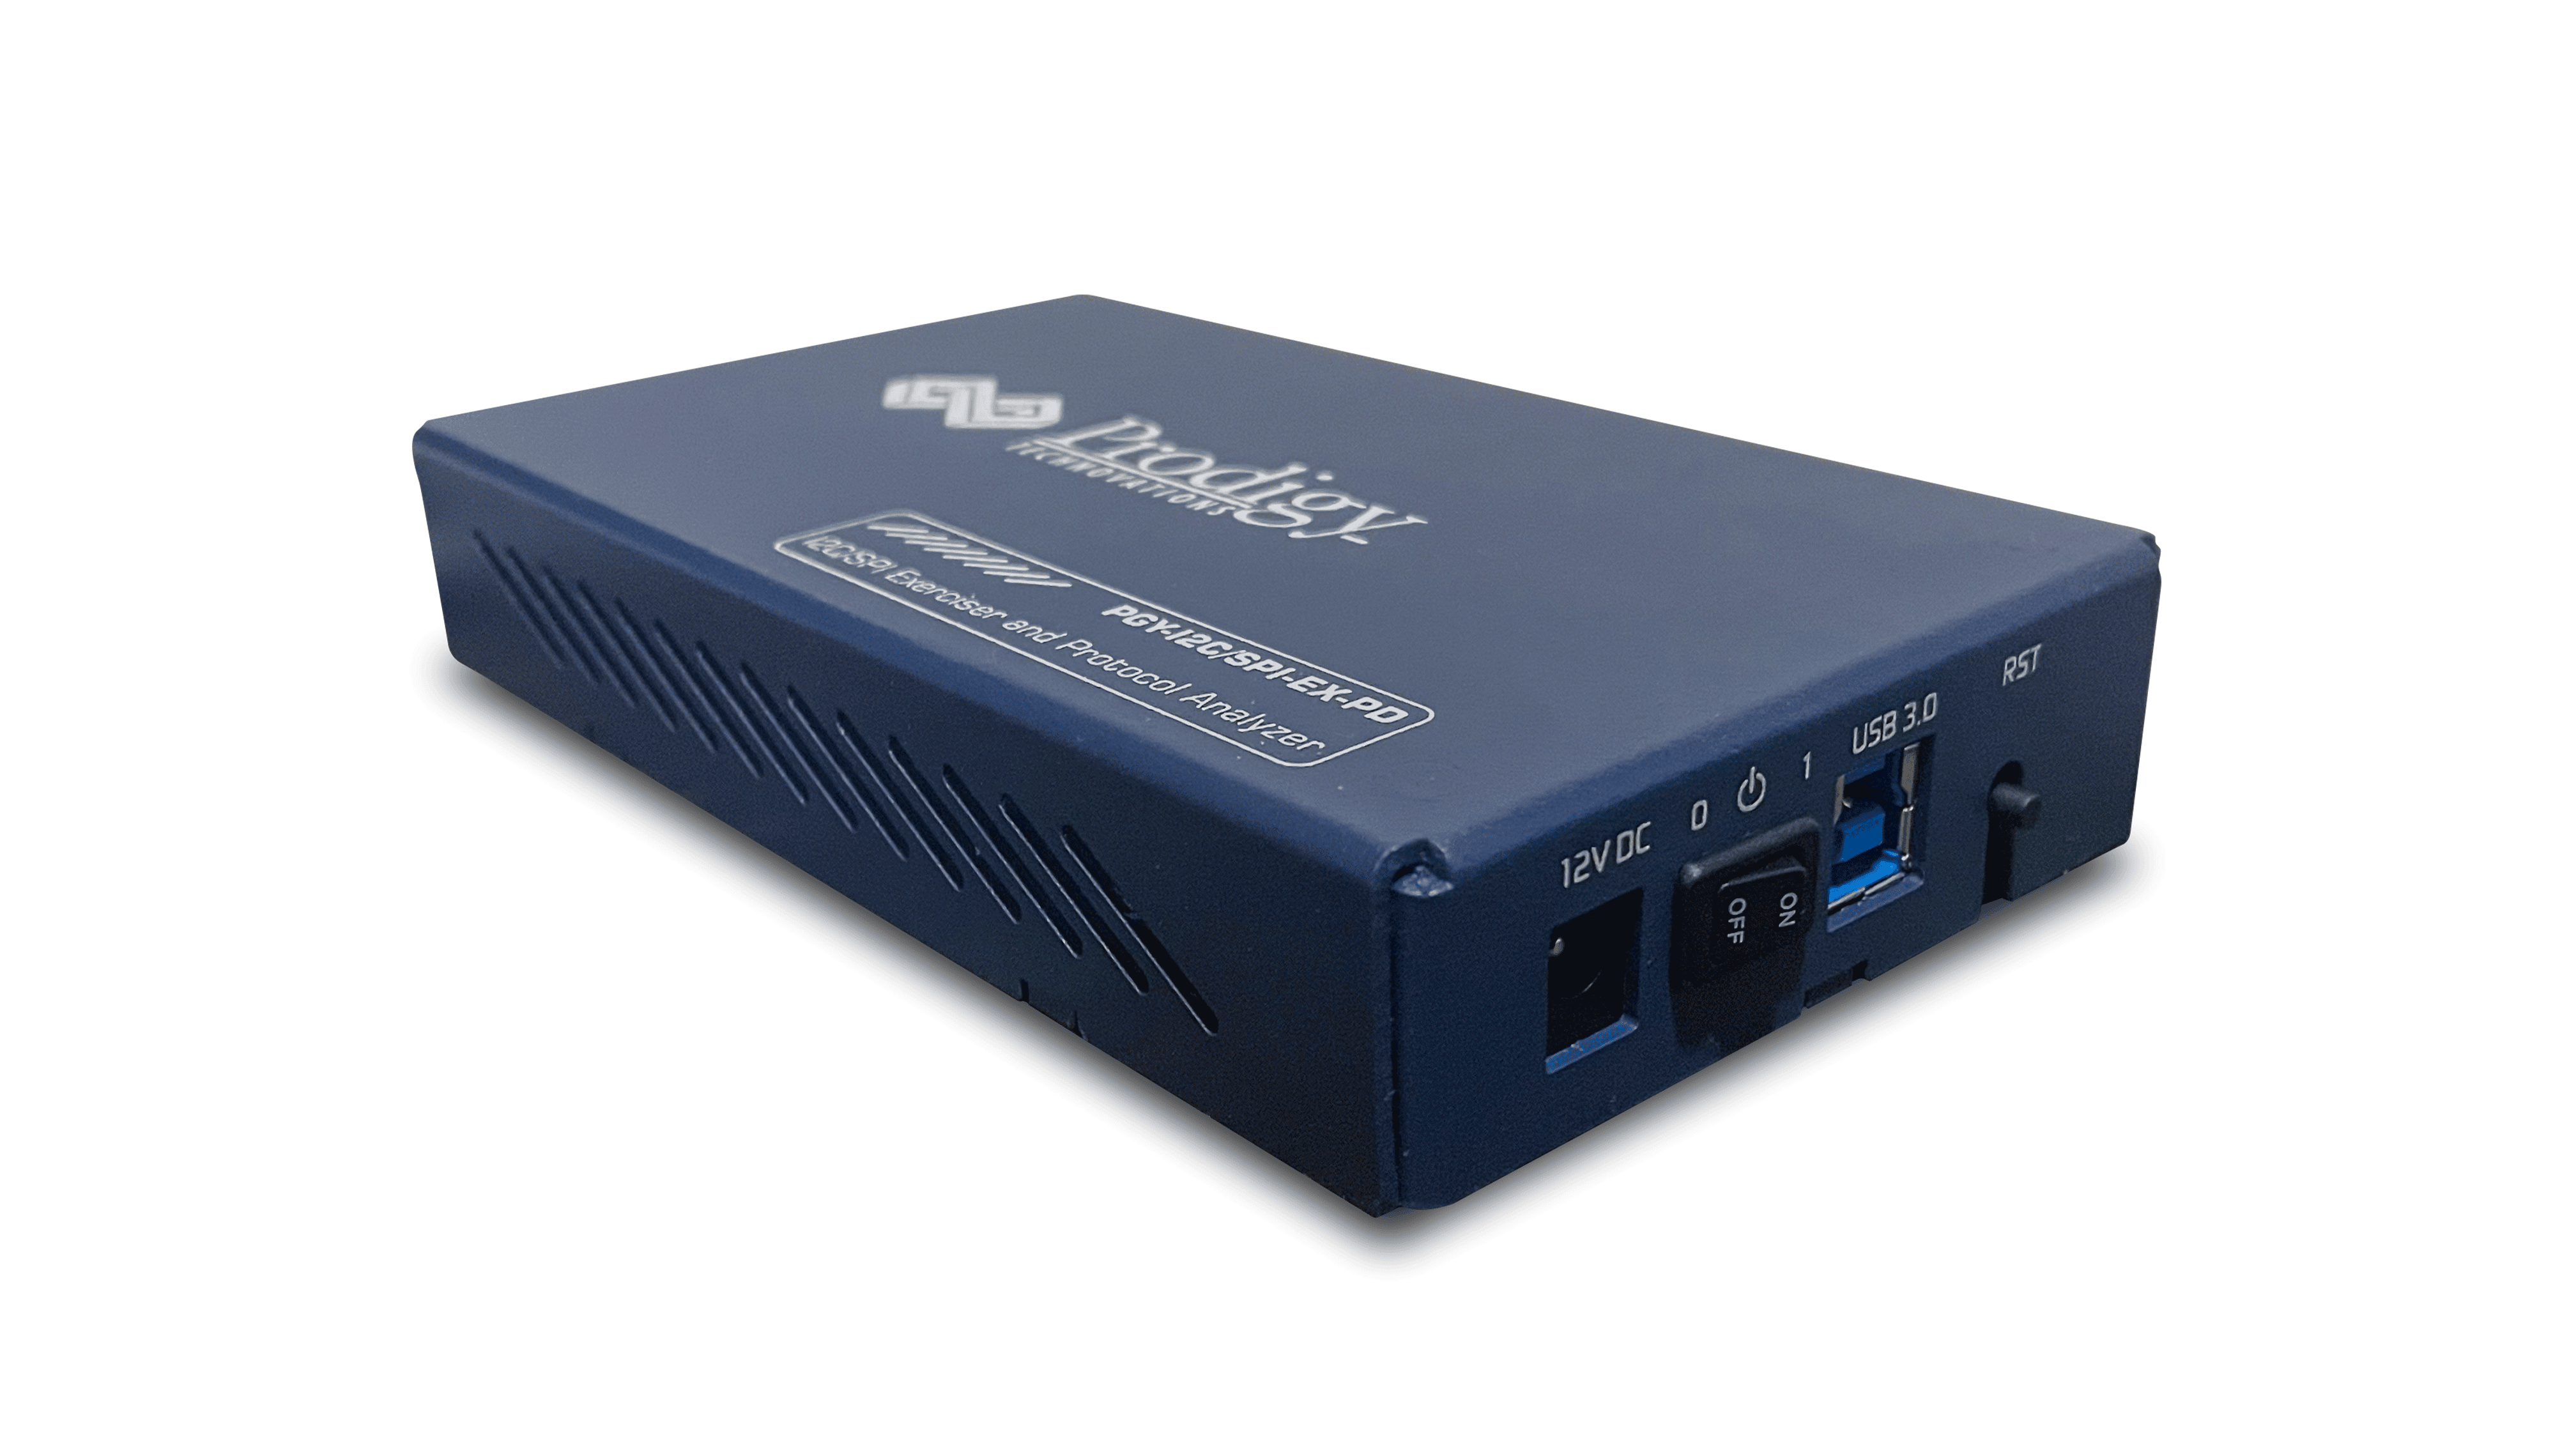
Features I2C/SPI Protocol Analyzer and Exerciser
- Supports I2C Specifications
- Supports SPI Specifications
- Ability to configure it as Master/Slave
- Generate different I2C/SPI Packets
- Variable data speeds
- Generate I2C/SPI traffic and protocol decode of the bus
- A timing diagram of the protocol decoded bus
- Listing view of protocol activity
- Ability to write exerciser script to combine multiple frame generation at different data speeds
- USB 2/3 host computer interface
- Continuous streaming of protocol activity to host system HDD/SSD
- API support for automation in python or C#
Price on request
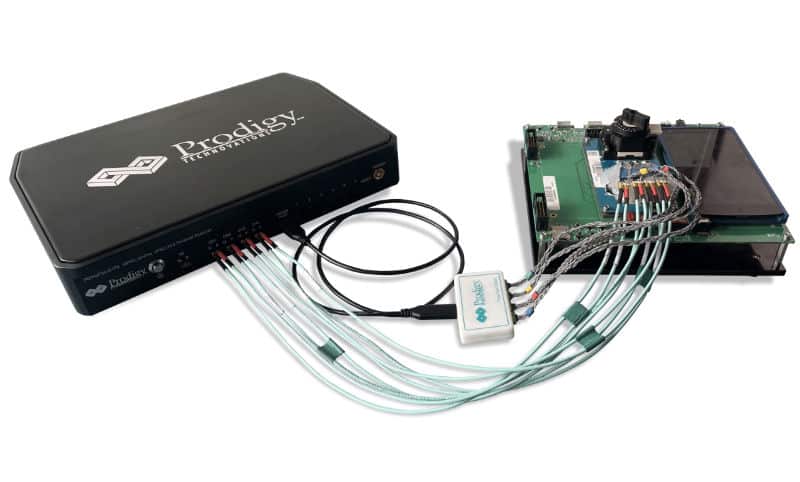
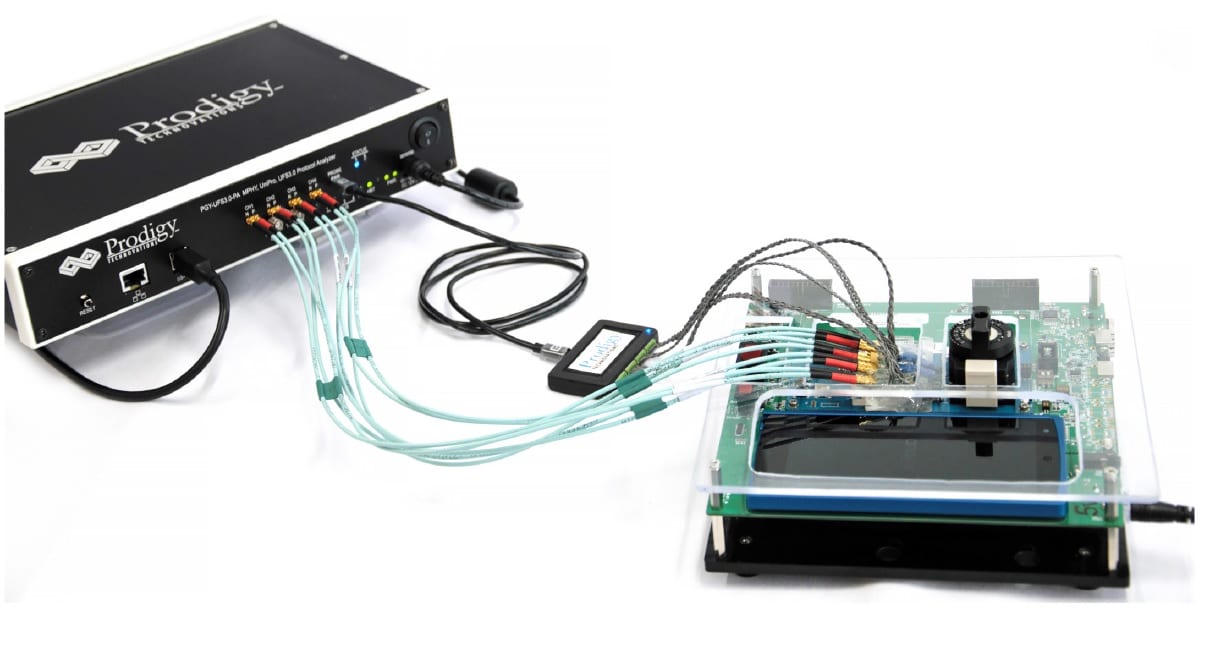
Features UFS 4.0 Protocol Analyzer
- Supports version MPHY 5.0, UniPro 2.0, and UFS v2.1/3.1/4.0
- Supports PWM G1 to G7 and HS G1, 2, 3, 4, 5 Rate A and B Series
- Supports one/two data lanes (2 TX and 2 RX)
- Flexibility to capture very large data using continuous streaming of Protocol data to host computer with 16GB Internal acquisition memory field upgradeable up to 64GB.
- Hardware-based resizable circular buffer with pre/post-trigger.
- Flexibility to decode selected data from a 16GB buffer.
- Solder down active probe provides high signal fidelity.
- Decoding at MPHY, UniPro, and UFS layers.
- Trigger-based on MPHY, UniPro, and UFS layers packet content.
- Trigger out a signal at the trigger event allows the triggering of other instruments such as an oscilloscope.
- Interface to host system using USB 3.0.
- Flexibility to upgrade the hardware firmware using the GbE interface provides easy field up-gradation of FPGA firmware.
- Decoded data packets can be exported to a text file for further analysis.
- Lightweight and can be deployed for on-site/ field tests.
Price on request
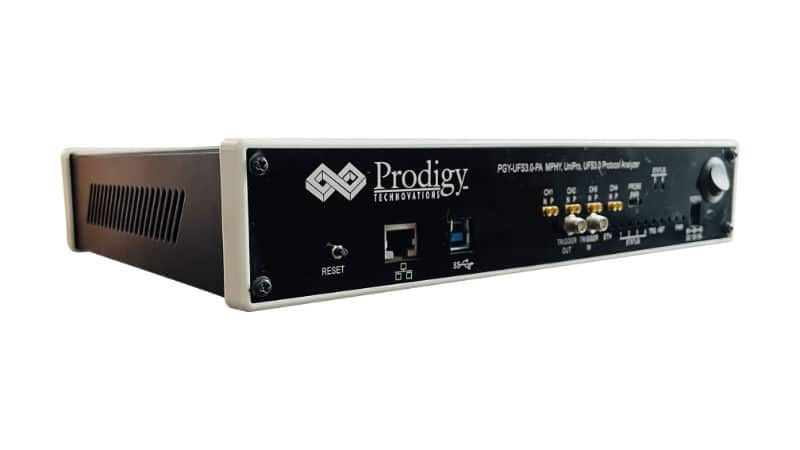
Features UFS 3.1 Protocol Analyzer
- Supports version MPHY 4.0, UniPro 1.8, and UFS version 2.1/3.1
- Supports PWM G1 to G7 and HS G1,2,3,4 A and B Series · Supports one/two data lanes (2 TX and 2 RX)
- Flexibility to capture very large data using continuous streaming of Protocol data to host computer
- Hardware-based circular buffer
- Flexibility to decode selected data from 8GB Buffer
- Solder down active probe provides high signal fidelity
- Decoding at MPHY, UniPro, and UFS layer
- Trigger-based on MPHY, UniPro, UFS layer packet content
- Supports triggering in PWM and HS data rate speeds
- Trigger out a signal at the trigger event allows the triggering of other instruments such as oscilloscope
- Interface to host system using USB 3.0 or Gigabit Ethernet Interface
- Flexibility to upgrade the hardware firmware using the GbE interface provides easy field up-gradation of FPGA firmware
- Decoded data packets can be exported to a text file for further analysis
- PGY-UFS 3.0-PA Protocol Analyzer is lightweight and can be deployed for on-site/ field tests
Price on request
Features PGY-PMBus-EX-PD PM Protokoll Exerciser and Analyzer
- Supports PMBus Specifications.
- Ability to configure it as Master/Slave.
- Variable data speeds.
- Generate PMbus traffic and protocol decode of the bus.
- A timing diagram of the protocol decoded bus.
- Listing view of protocol activity.
- Ability to write exerciser script to combine multiple frame generation at different data speeds.
- USB 2/3 host computer interface.
- Continuous streaming of protocol data to host computer to provide a large buffer.
- API support for automation in python or C++.
Price on request

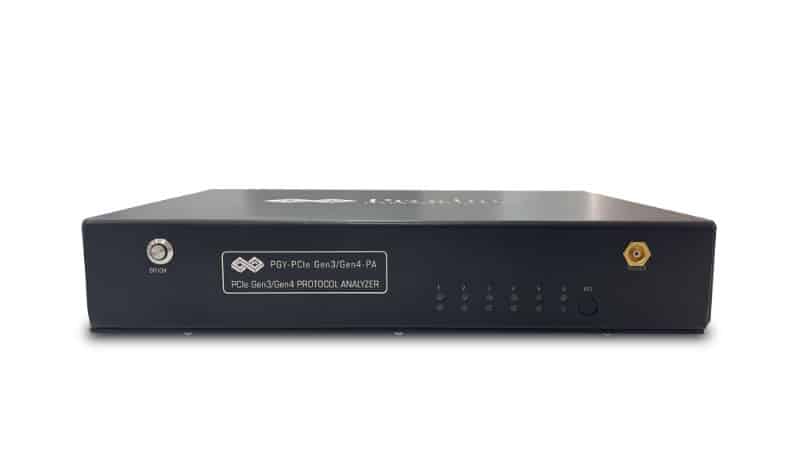
Features PCIe Protocol Analyzer
- PCIe Gen1/2/3/4-X4 Protocol Decode and Analysis.
- Currently supports four lane PCIeGen1/2/3/4 Bus.
- Active M.2 Connector interposer for speeds up to PCIe Gen4 is standard offering with protocol analyzer.
- Optional Passive M.2 Connector interposer for speeds up to PCIe Gen3.
- Optional solder down probe tips for four lanes for speeds up to PCIe Gen3 (8Gbps)
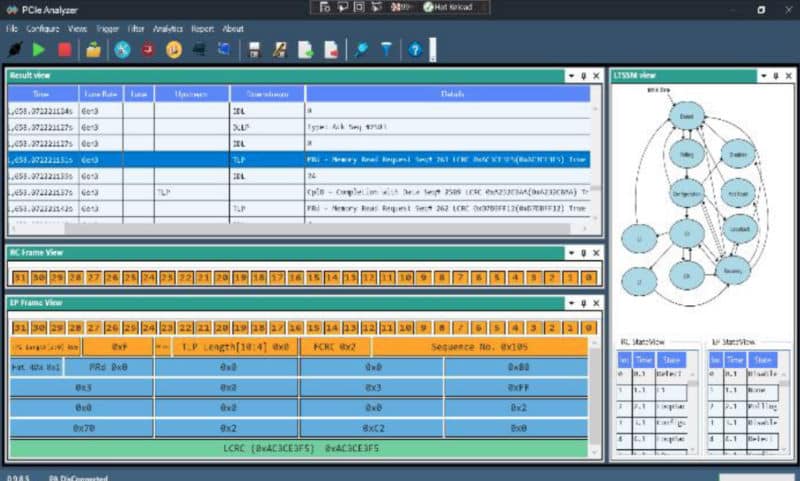
- Protocol Decoding of TS1, TS2, TLP, DLLP Packets.
- Hardware based protocol packet TS1, TS2 and IDLE filter capabilities.
- Software based search, filter-in and filter-out capabilities.
- Hardware based protocol aware trigger capabilities.
- Advanced multi-level if-then-else if trigger capabilities.
- Standard buffer size of 16GB and expandable to 64GB combined for TX and RX.
- Trigger based on TS1, TS2, TLP and DLLP Packet content.
- Detailed view of each TLP/DLLP with all field values.
- LTSSM Analysis for PCIe protocol traffic.
- Memory segmentation with each segment with different trigger condition¹.
- Trigger out signal at trigger event allows the triggering of other instruments such as an oscilloscope.
- Interface to host system using USB 3.0.
- Decoded data packets can be exported to .txt file for further analysis.
- PGY Protocol Analyzer is light weight and can be deployed for on-site/ field tests.
- Field upgradeable enables the unit to easy maintain for latest feature set.
Price on request
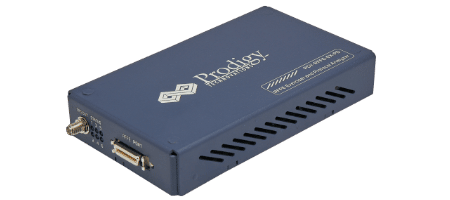
Features RFFE Protocol Analyzer and Exerciser
- Supports RFFE2.0/2.1 Specification
- Ability to configure it as Master or Slave
- Generate different RFFE at full speed and half of full frequency speed
- Error Injection such as parity errors and ACK/NACK errors
- Variable RFFE data speeds
- Simultaneously generate RFFE traffic and Protocol decode of the Bus
- The timing diagram of the Protocol decoded bus
- Listing view of Protocol activity
- Error Analysis in Protocol Decode
- Ability to write exerciser script to combine multiple data frame generation at different data speeds
- USB2/3 host computer interface
- Flexibility to upgrade to the unit for evolving RFFE Specification
Price on request
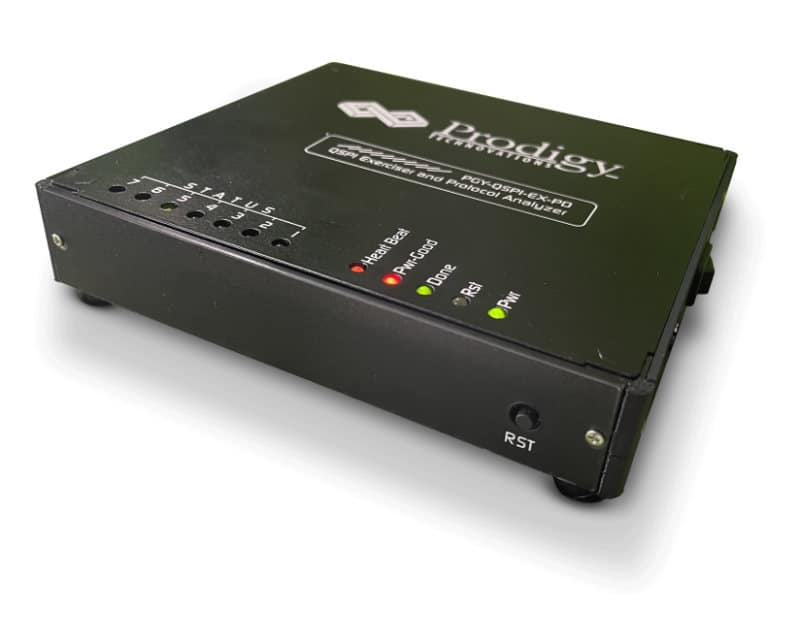
Features QSPI Protocol Exerciser and Analyzer
- Supports QSPI speeds of up to 80MHz*
- Ability to configure it as Master or Slave
- Simultaneously generate QSPI traffic and Protocol decode of the Bus
- QSPI Master and Slaves
- STR and DTR Transfer rates
- Extended, Dual, and Quad QSPI Modes Supported
- Variable QSPI data speeds and duty cycle
- Continuous streaming of protocol data to the host computer to provide a large buffer in sniffer mode
- The timing diagram of the protocol decoded bus
- Listing view of Protocol activity
- Error Analysis in Protocol Decode
- Ability to write exerciser script to combine multiple data frame generation at different data speeds
- USB 2.0/3.0 host computer interface
- API support for automation in Python or C++
Price on request
Features SD Protocol Analyzer
- Continuous monitoring of protocol data for a long time to capture elusive events (more than 30GB data capture)
- Analysis of captured data per standards for protocol integrity, count of data bursts, CMD CRC errors, Response CRC errors, Data CRC errors, Timing Values, and Reserved commands
- Hardware-based protocol-aware trigger capability in real-time enables capturing specific Events. Triggering facility on patterns, commands, or error events.
- Users can identify the anomalies by decoding command and response arguments.
- Analytics feature provides analysis of acquired protocol data by plotting command, response, data, and frequency of operation over acquired time.
- The analytics feature also provides the decoding of device registers for easy analysis.
- Filters allow you to view specific packets in decoded protocol packets.
- Search feature for specific events in protocol activity.
- Easy-to-use user interfaces save time on the learning curve.
- Handles long-duration capture and displays the decoded data without demanding extensive resources in the host computer.
- Inserting markers [using Trigger-In] in protocol activity helps in correlating the input digital signal with Protocol Activity.
- Trigger-out signal for any specific protocol event allows triggering of other instruments such as an oscilloscope.
- Interface to host system [running UI] using USB3.0 or Gigabit Ethernet interface.
- Flexibility to upgrade the hardware firmware using the GbE interface provides easy field up-gradation of the firmware.
- Export of Decoded data packets to txt file for further analysis.
Price on request
Features PGY-SMI-EX-PD SMI Protocol Analyzer and Exerciser
- Supports SMI (MDIO) speeds up to 25MHz
- Configuration as master or slave
- Simultaneous SMI traffic generation and protocol decoding
- Support for SMI clause 22 and 45
- Variable SMI data speeds and duty cycle
- Continuous streaming of protocol data to the host computer to provide a large buffer
- Timing diagram of the protocol-decoded bus
- Listing view of log activity
- Ability to write a training script to combine the generation of multiple data frames at different data rates
- USB 2.0/3.0 interface for host computer
- API support for automation in Python or C++
Price on request
Features PGY-SPMI-EX-PD SPMI Protocol Analyzer and Exerciser
- Supports SPMI v 1.0/ 2.0 specifications
- Ability to configure it as Master or Slave
- Supports Sole Master feature
- Supports Request Capable Slave (RCS) feature
- Supports the complex BUS arbitration process
- Generate different SPMI Packets
- Error injection such as parity error, ACK/NACK error, and Skip SSC error
- Variable SPMI data speeds (32kHz – 26Mhz1), Voltage drive levels (1.2 or 1.8), and Duty Cycle (25%,50%, and 75%).
- Simultaneously generate SPMI traffic and Protocol decode of the Bus
- Continuous streaming of protocol data to HDD/SSD
- The timing diagram of the Protocol decoded bus
- Listing view of Protocol activity
- Error Analysis in Protocol decoded data
- Ability to write exerciser script to combine multiple
- data frame generation at different data speeds
- USB2/3 host computer interface
- API support for automation in Python and C++
- Flexibility to upgrade to the unit for evolving SPMI Specification
- Optional Protocol Implementation Compliance Statement (PICS) supports scripts
Price on request
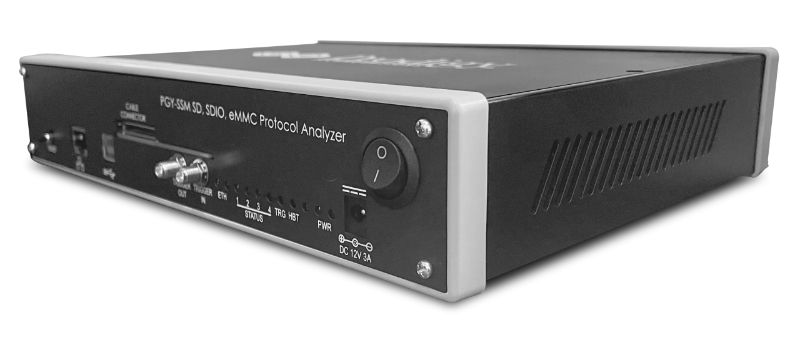
Features SDIO Protocol Analyzer
- Continuous monitoring of protocol data for a long time to capture elusive events (more than 30GB data capture)
- Analysis of captured data per standards for protocol integrity, count of data bursts, CMD CRC errors, Response CRC errors, Data CRC errors, Timing Values, and Reserved commands
- Hardware-based protocol-aware trigger capability in real-time enables capturing specific Events. Triggering facility on patterns, commands, or error events.
- Users can identify the anomalies by decoding command and response arguments.
- Analytics feature provides analysis of acquired protocol data by plotting command, response, data, and frequency of operation over acquired time.
- The analytics feature also provides the decoding of device registers for easy analysis.
- Filters allow you to view specific packets in decoded protocol packets.
- Search feature for specific events in protocol activity.
- Easy-to-use user interfaces save time on the learning curve.
- Handles long-duration capture and displays the decoded data without demanding extensive resources in the host computer.
- Inserting markers [using Trigger-In] in protocol activity helps in correlating the input digital signal with Protocol Activity.
- Trigger-out signal for any specific protocol event allows triggering of other instruments such as an oscilloscope.
- Interface to host system [running UI] using USB3.0 or Gigabit Ethernet interface.
- Flexibility to upgrade the hardware firmware using the GbE interface provides easy field up-gradation of the firmware.
- Export of Decoded data packets to txt file for further analysis.
Price on request
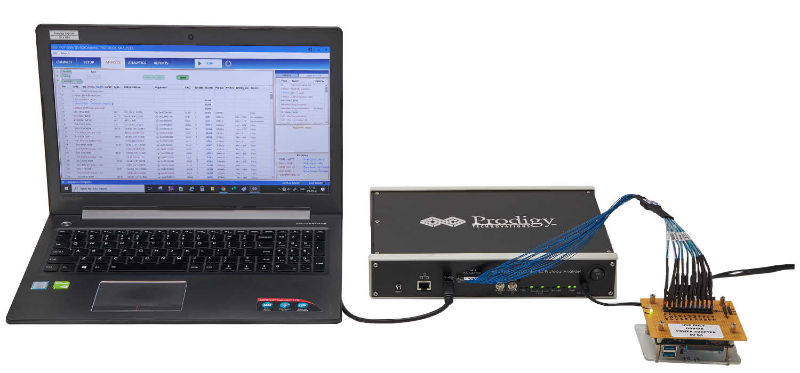
Features SD/SDIO/eMMC Protocol Analyzer
- Continuous monitoring of protocol data for a long time to capture elusive events (more than 30GB data capture)
- Analysis of captured data per standards for protocol integrity, count of data bursts, CMD CRC errors, Response CRC errors, Data CRC errors, Timing Values, and Reserved commands
- Hardware-based protocol-aware trigger capability in real-time enables capturing specific Events. Triggering facility on patterns, commands, or error events.
- Users can identify the anomalies by decoding command and response arguments.
- Analytics feature provides analysis of acquired protocol data by plotting command, response, data, and frequency of operation over acquired time.
- The analytics feature also provides the decoding of device registers for easy analysis.
- Filters allow you to view specific packets in decoded protocol packets.
- Search feature for specific events in protocol activity.
- Easy-to-use user interfaces save time on the learning curve.
- Handles long-duration capture and displays the decoded data without demanding extensive resources in the host computer.
- Inserting markers [using Trigger-In] in protocol activity helps in correlating the input digital signal with Protocol Activity.
- Trigger-out signal for any specific protocol event allows triggering of other instruments such as an oscilloscope.
- Interface to host system [running UI] using USB3.0 or Gigabit Ethernet interface.
- Flexibility to upgrade the hardware firmware using the GbE interface provides easy field up-gradation of the firmware.
- Export of Decoded data packets to txt file for further analysis.
Price on request

Features PGY-UART-EX-PD UART Protokoll Exerciser and Analyzer
- Supports custom UART traffic generation
- Simultaneously generate UART traffic and Protocol decode of the bus
- Variable UART baud rates
- Continuous streaming of protocol data to the host computer to provide a large buffer
- A timing diagram of Protocol decoded bus
- Listing view of Protocol activity
- Error Analysis in Protocol Decode
- Ability to write exerciser script to combine multiple data frame generation at different data speeds
- USB 2.0/3.0 host computer interface
- API support for automation in Python or C++
Price on request

Features JTAG Protocol Analyzer and Exerciser
- Supports JTAG frequencies of up to 25MH
- Simultaneously generate JTAG traffic and Protocol decode of the Bus
- JTAG Master Capability
- Variable JTAG Data speeds and Duty cycle
- User-defined TCK & TDI Delays
- Continuous streaming of protocol data to the host computer to provide a large buffer
- A timing diagram of Protocol decoded bus
- Listing view of Protocol activity
- Error Analysis in Protocol Decode
- Ability to write exerciser script to combine multiple data frame generation at different data speeds
- USB 2.0/3.0 host computer interface
- API support for automation in Python or C++
Price on request
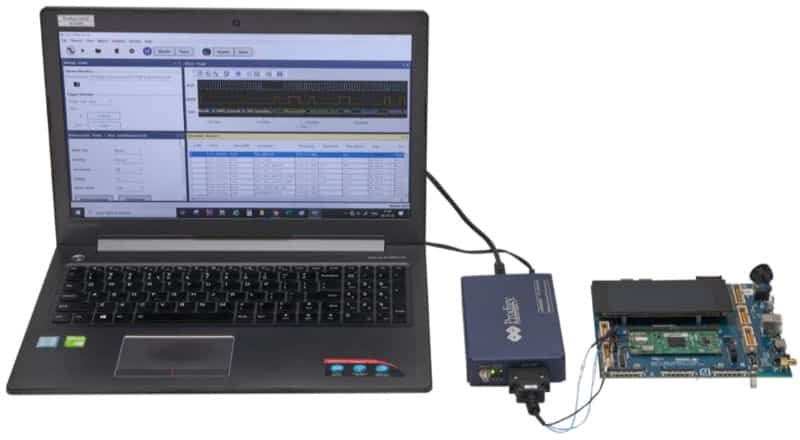
Features eMMC Protocol Analyzer
- Continuous monitoring of protocol data for a long time to capture elusive events (more than 30GB data capture)
- Analysis of captured data per standards for protocol integrity, count of data bursts, CMD CRC errors, Response CRC errors, Data CRC errors, Timing Values, and Reserved commands
- Hardware-based protocol-aware trigger capability in real-time enables capturing specific Events. Triggering facility on patterns, commands, or error events.
- Users can identify the anomalies by decoding command and response arguments.
- Analytics feature provides analysis of acquired protocol data by plotting command, response, data, and frequency of operation over acquired time.
- The analytics feature also provides the decoding of device registers for easy analysis.
- Filters allow you to view specific packets in decoded protocol packets.
- Search feature for specific events in protocol activity.
- Easy-to-use user interfaces save time on the learning curve.
- Handles long-duration capture and displays the decoded data without demanding extensive resources in the host computer.
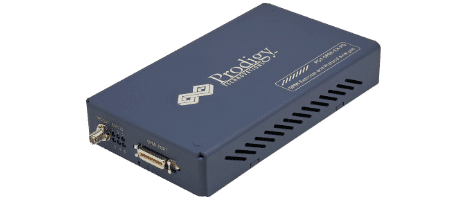
- Inserting markers [using Trigger-In] in protocol activity helps in correlating the input digital signal with Protocol Activity.
- Trigger-out signal for any specific protocol event allows triggering of other instruments such as an oscilloscope.
- Interface to host system [running UI] using USB3.0 or Gigabit Ethernet interface.
- Flexibility to upgrade the hardware firmware using the GbE interface provides easy field up-gradation of the firmware.
- Export of Decoded data packets to txt file for further analysis.
Price on request

Features PGY-SMBus-EX-PD SM Protokoll Exerciser and Analyzer
- Supports SMBus 3.4Mbps Speed
- Ability to configure it as Master or Slave
- Simultaneously generate SMBus traffic and Protocol decode of the Bus
- SMBus Master and Slaves
- Error Injection ACK/NACK errors
- Variable SMBus data speeds and duty cycle
- Continuous streaming of protocol data to the host computer to provide a large buffer
- A timing diagram of Protocol decoded bus
- Listing view of Protocol activity
- Error Analysis in Protocol Decode
- Ability to write exerciser script to combine multiple data frame generation at different data speeds
- USB 2.0/3.0 host computer interface
- API support for automation in Python or C++
Price on request