Description
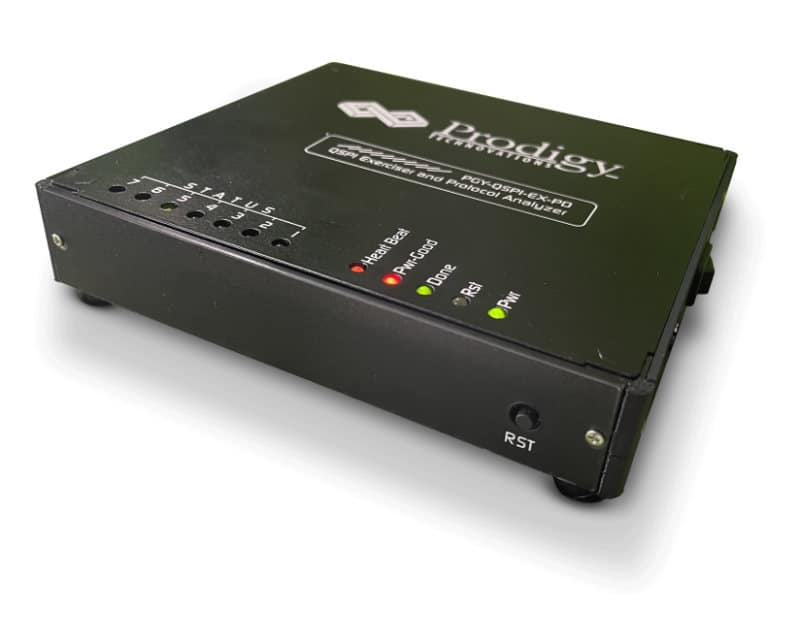
SPMI Protocol Analyzer (PGY-SPMI-EX-PD) is the Protocol Analyzer with multiple features to capture and debug communication between host and design under test. SPMI (System Power Management Interface) is a MIPI (Mobile Industry Processor Interface) standard with a 2-wire synchronous serial, a bidirectional interface that connects the integrated Power Controller(PC) of a System on-Chip (SoC) processor system with one or more Power Management Integrated Circuits (PMIC) voltage regulation systems.
PGY-SPMI-EX-PD is the leading instrument that enables the design and test engineers to test the SPMI designs for its specifications by configuring PGY-SPMI-EX-ED as master/slave, generating SPMI traffic with time variation and error injection capability and decoding SPMI Protocol packets.
Features PGY-SPMI-EX-PD SPMI Protocol Analyzer and Exerciser
- Supports SPMI v 1.0/ 2.0 specifications
- Ability to configure it as Master or Slave
- Supports Sole Master feature
- Supports Request Capable Slave (RCS) feature
- Supports the complex BUS arbitration process
- Generate different SPMI Packets
- Error injection such as parity error, ACK/NACK error, and Skip SSC error
- Variable SPMI data speeds (32kHz – 26Mhz1), Voltage drive levels (1.2 or 1.8), and Duty Cycle (25%,50%, and 75%).
- Simultaneously generate SPMI traffic and Protocol decode of the Bus
- Continuous streaming of protocol data to HDD/SSD
- The timing diagram of the Protocol decoded bus
- Listing view of Protocol activity
- Error Analysis in Protocol decoded data
- Ability to write exerciser script to combine multiple
- data frame generation at different data speeds
- USB2/3 host computer interface
- API support for automation in Python and C++
- Flexibility to upgrade to the unit for evolving SPMI Specification
- Optional Protocol Implementation Compliance Statement (PICS) supports scripts
Comprehensive Protocol Analysis using Multi-View
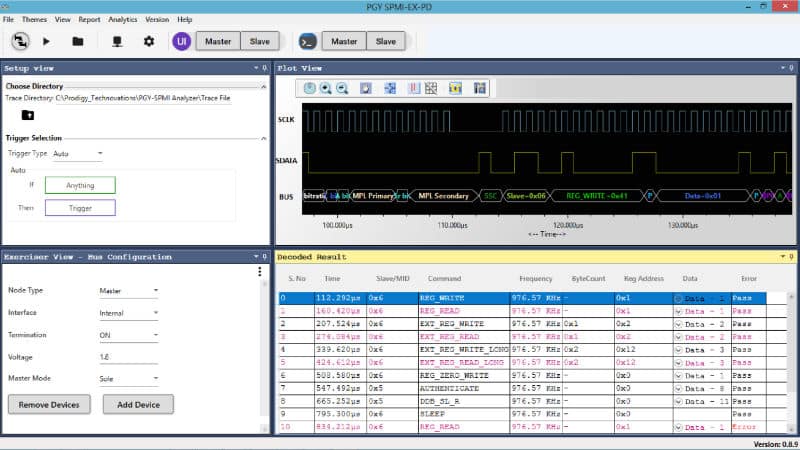
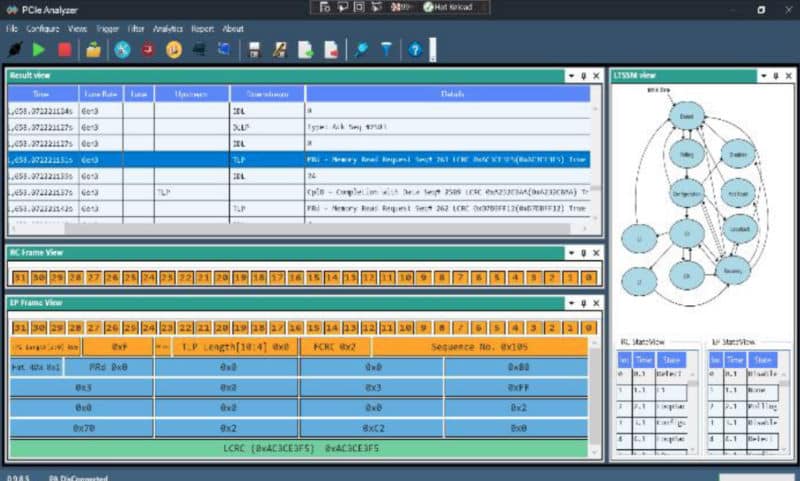
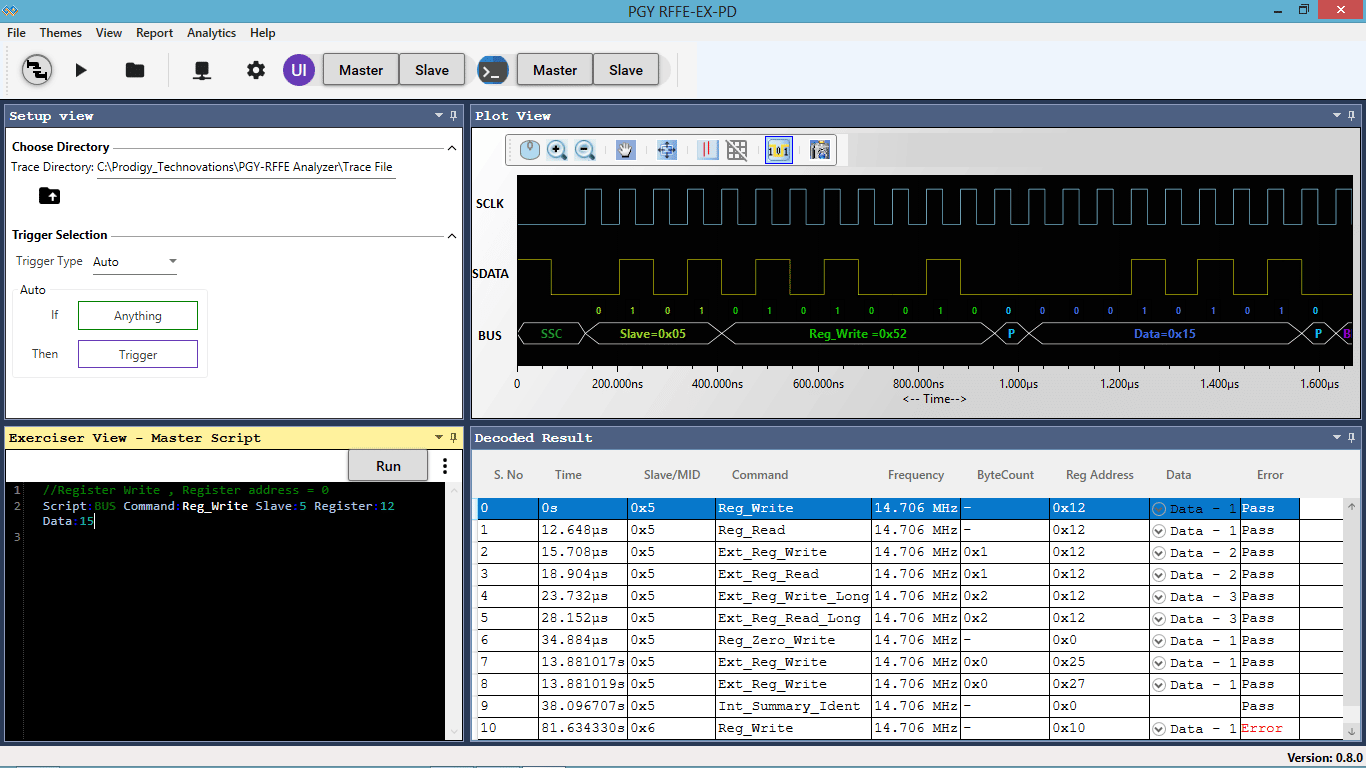
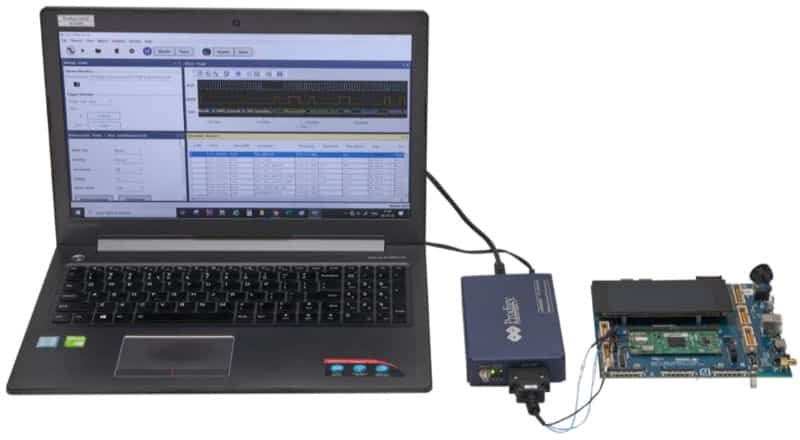
Multidomain View provides the complete view of SPMI Protocol activity in a single GUI. Users can easily set up the analyzer to generate SPMI traffic using a GUI or script. Users can set different trigger conditions from the setup menu to capture Protocol activity at a specific event and decode the transition between Master and Slave. The decoded results can be viewed in the timing diagram and Protocol listing window with autocorrelation. This comprehensive view of information makes it the industry’s best, offering an easy-to-use solution to debug the SPMI protocol activity. Continuous streaming protocol activity to host system HDD/SSD ensures seamless roll mode operation without the need to recapture data when DUT/s are set to different states thereby saving test times.
Exerciser
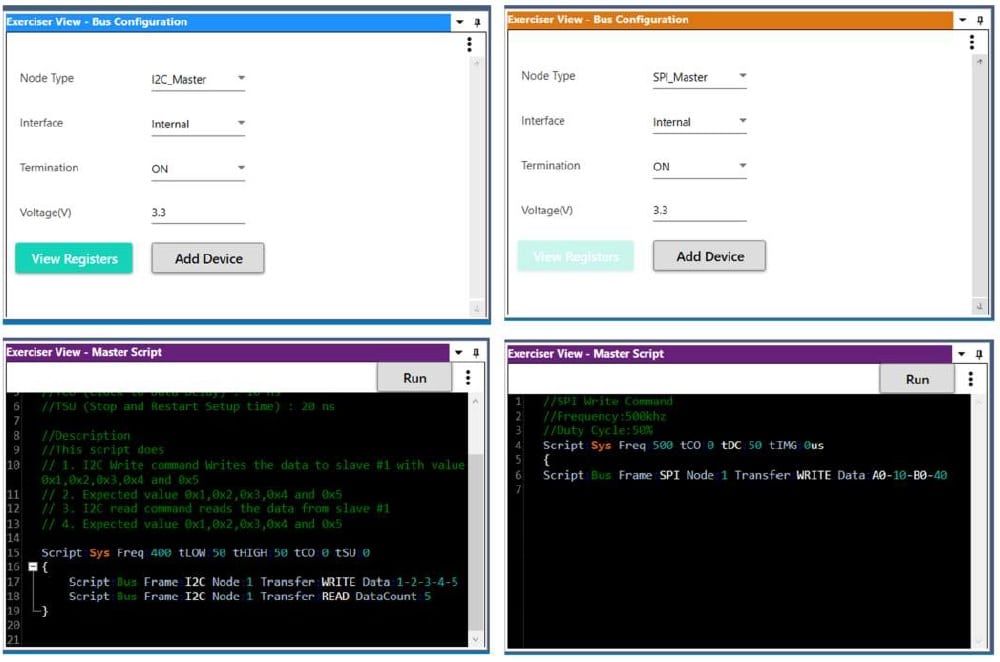
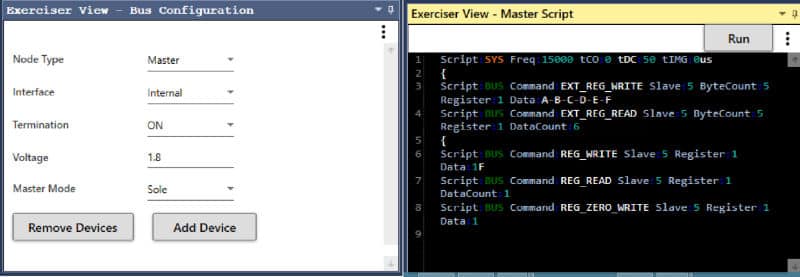
PGY-SPMI-EX-PD supports SPMI traffic generation using GUI and Script. Users can generate simple traffic generation using the GUI to test the DUT. Script-based GUI provides flexibility to emulate the complete expected traffic in the real world including error injections. In this sample, the script user can generate SPMI traffic as below.
- Script line #1: Reg Write to the slave with USID 05
- Script line #2: Reg Read to the slave with USID 05
- Script line #3: Ext Reg Write to the slave with USID 05
- Script line #4: Ext Reg Read to the slave with USID 05
Timing Diagram and Protocol Listing View
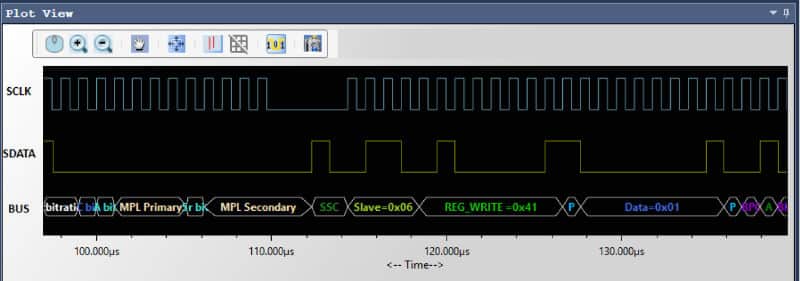
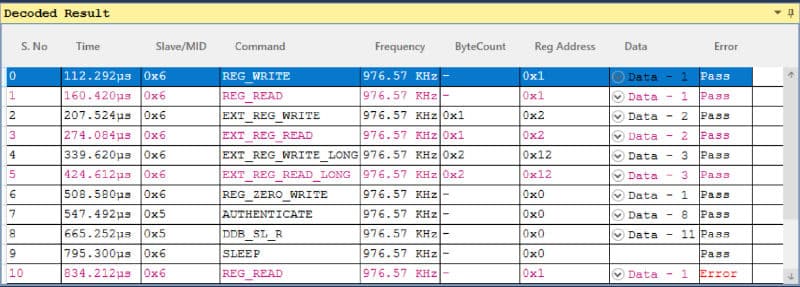
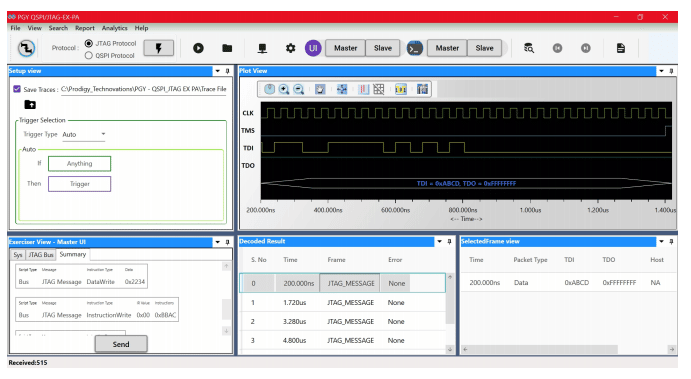
The timing view provides the plot of SCKL and SDATA signals with a bus diagram. Overlaying of Protocol bits on the digital timing waveform will help easy debugging of Protocol decoded data. Cursor and Zoom features will make it convenient to analyze Protocol in the timing diagram for any timing errors. The protocol window provides the decoded packet information in each state and all packet details. The selected frame in the Protocol listing window will be autocorrelated in the timing view to view the timing information of the packet.
Powerful Trigger Capabilities
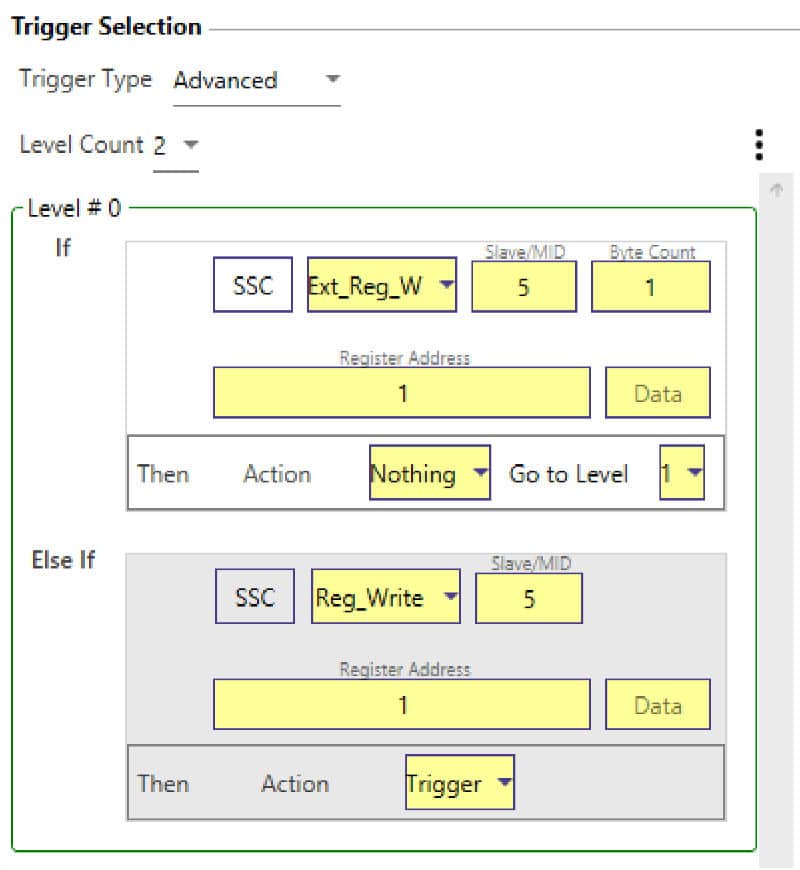
PGY-SPMI-EX-PD supports simple trigger capabilities. The analyzer can trigger on any of the Protocol packets such as Reg Write, SLEEP or WAKE UP. Advanced Trigger provides the flexibility to monitor Multiple trigger conditions and can set multiple state trigger machines. Users can initiate a timer and trigger onset timer values.
Warranty
Hardware and software are covered by a one-year warranty. Probes are covered three months warranty for all manufacturing defects
Technical Data
| Specification | |
|---|---|
| Configuration option | 1 master + 2 slaves |
| SPMI Traffic Generation | Custom SPMI traffic generation and simulation of real network traffic |
| SCL frequency | 32kHz to 26MHz |
| Drive level voltage | 1.2V or 1.8V |
| Command sequence support | All command sequences are supported except DDB Master Read |
| SCLK duty cycle variation | YES (can be 25%, 50%, 75%) |
| SCLK & SDATA Delay | Resolution (4ns) |
| Delay between two messages | Yes |
| Specification | SPMI 1.0 and SPMI 2.0 |
| SPMI network | Sole master and multi-master |
| Error injection | Master - Data parity, command parity, address parity, Skip SSC (only in Sole master systems); Slave - Data parity (NON RCS) |
| Supported Protocol Analysis | SPMI |
| Protocol Views | Timing Diagram View Protocol Listing View Bus diagram to display Protocol packets with timing diagram |
| Protocol Trigger | Simple (triggers on custom SPMI packet after SSC) |
| Capture Duration | Continuous streaming log data |
| Protocol error report | Data parity, command parity, address parity, ACK/ NACK errors |
| Host Connectivity | USB 3.0 / 2.0 interface |



.jpg)
.jpg)
.jpg)
.jpg)

