Description
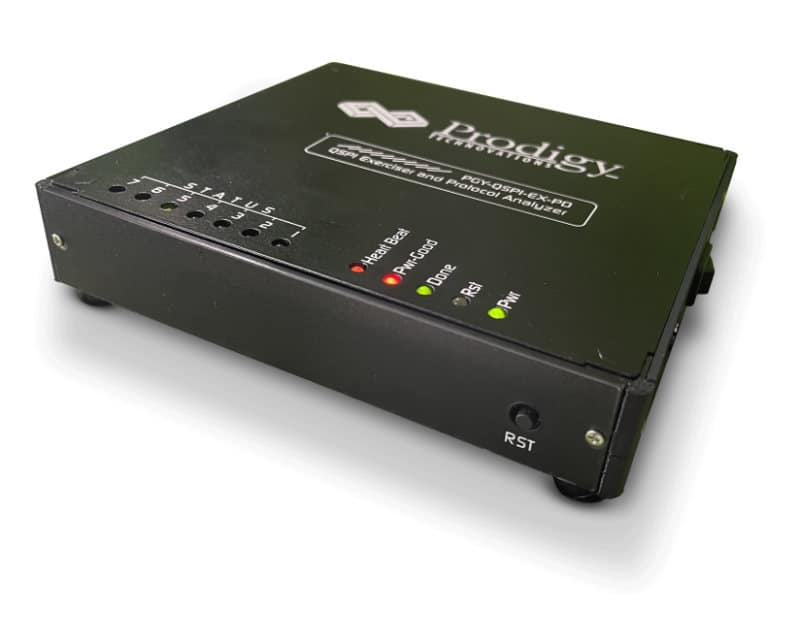
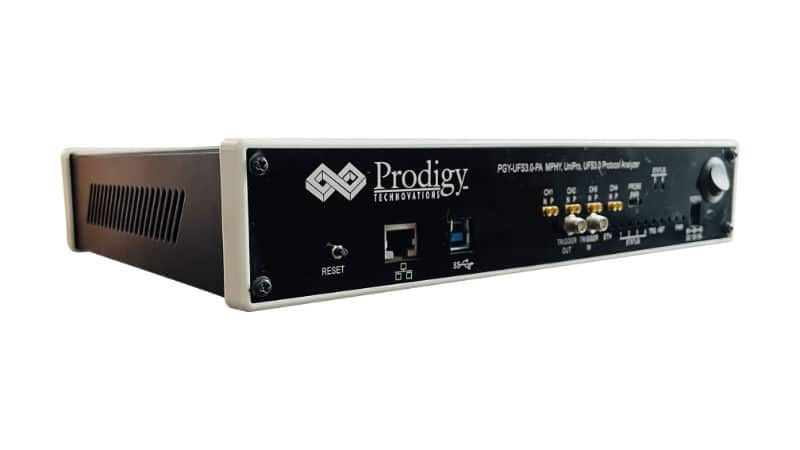
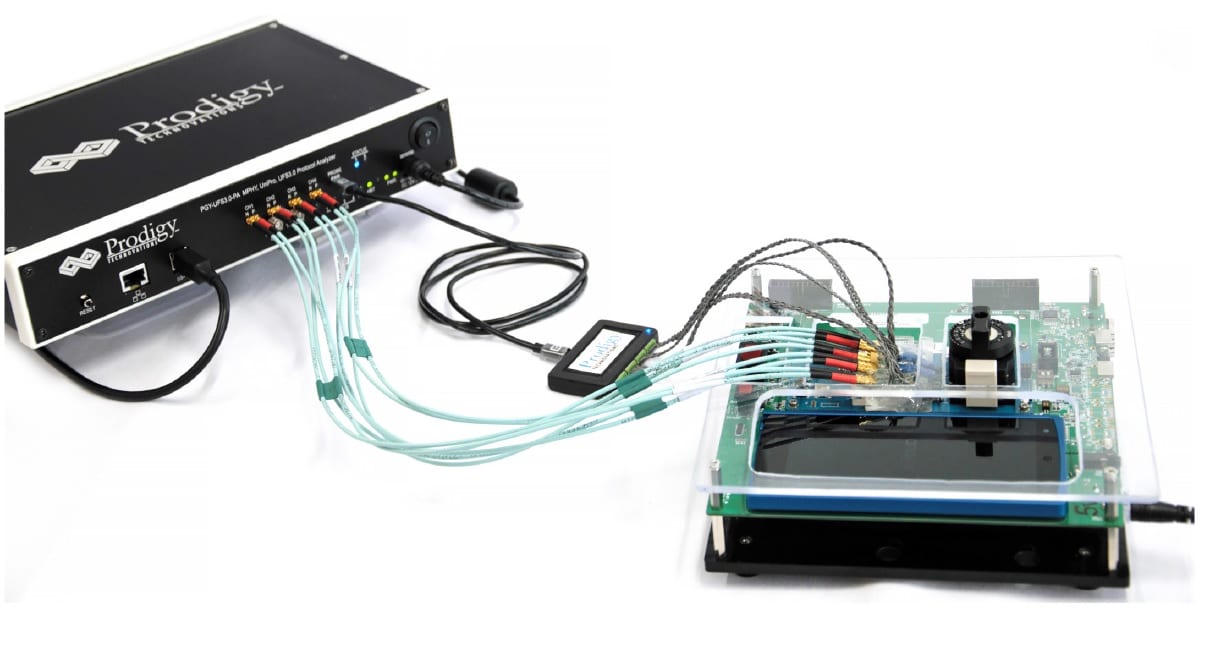
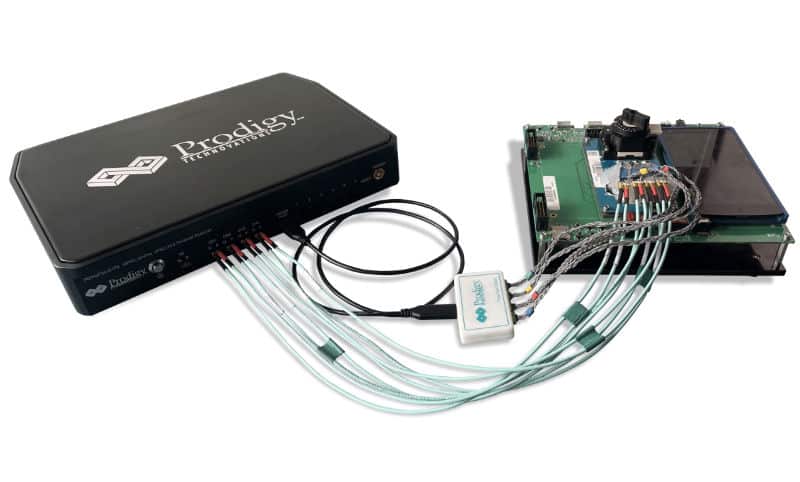
QSPI Protocol Exerciser and Analyzer (PGY-QSPI-EX-PD) is a Protocol Exerciser and Analyzer with multiple features to capture and debug the communication between the QSPI host and Device. PGY-QSPI-EX-PD is the only instrument that enables the design and test engineers to test the respective QSPI designs for their specifications by configuring the PGY-QSPI-EX-PD as Master/Slave, generating QSPI traffic, and decoding the QSPI protocol decode packets. PGY-QSPI-EX-PD can be configured only as a sniffer in case the user needs to monitor traffic between the host and device.
Features QSPI Protocol Exerciser and Analyzer
- Supports QSPI speeds of up to 80MHz*
- Ability to configure it as Master or Slave
- Simultaneously generate QSPI traffic and Protocol decode of the Bus
- QSPI Master and Slaves
- STR and DTR Transfer rates
- Extended, Dual, and Quad QSPI Modes Supported
- Variable QSPI data speeds and duty cycle
- Continuous streaming of protocol data to the host computer to provide a large buffer in sniffer mode
- The timing diagram of the protocol decoded bus
- Listing view of Protocol activity
- Error Analysis in Protocol Decode
- Ability to write exerciser script to combine multiple data frame generation at different data speeds
- USB 2.0/3.0 host computer interface
- API support for automation in Python or C++
Multi-Domain view
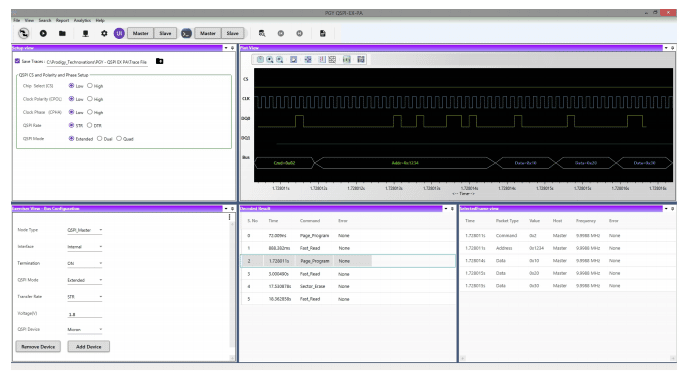
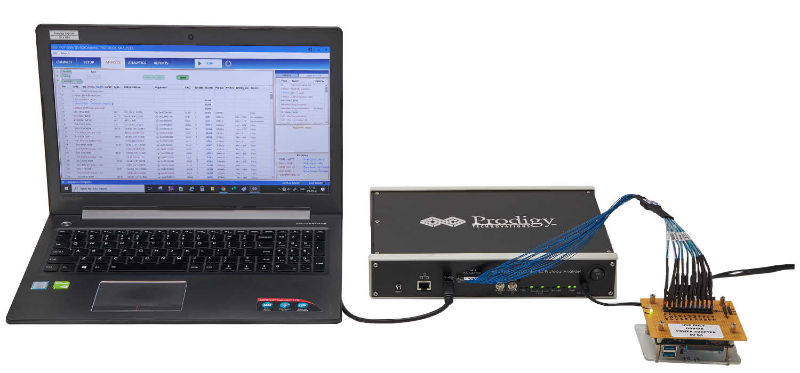
Multi-domain View provides the complete view of QSPI Protocol activity in a single GUI. Users can easily set up the analyzer to generate QSPI traffic using a GUI or script. Users can capture Protocol activity at specific events and decode the transition between Master and Slave. The decoded results can be viewed in the timing diagram and Protocol listing window with autocorrelation. This comprehensive view of information makes it the industry’s best, offering an easy-to-use solution to debug the QSPI protocol activity.
Exerciser
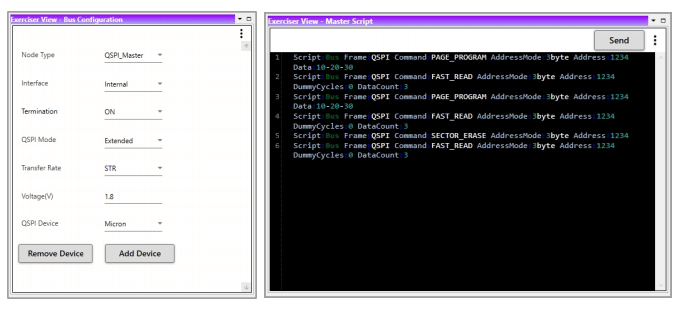
PGY-QSPI-EX-PD supports QSPI traffic generation using GUI and Script. Users can generate simple traffic generation using the GUI to test the DUT. Script-based GUI provides flexibility to emulate the complete expected traffic in the real-world including error injections. In this sample script user can generate QSPI traffic as below:
- Script Line #1: PAGE_PROGRAM
- Script Line #2: FAST_READ
- Script Line #3: PAGE_PROGRAM
- Script Line #4: FAST_READ
- Script Line #5: SECTOR_ERASE
- Script Line #6: FAST_READ
Timing Diagram and Protocol Listing View
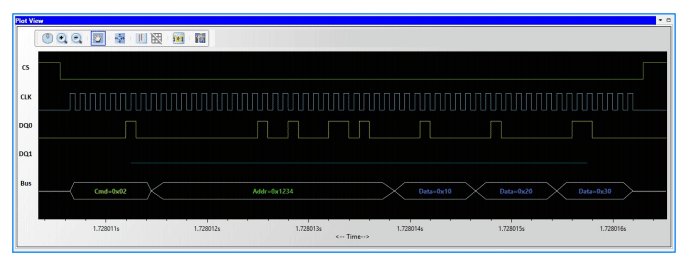

The timing view provides the plot of CS, CLK, DQO, and DQ1 signals with a bus diagram. Overlaying of Protocol bits on the digital timing waveform will help easy debugging of Protocol decoded data. Cursor and Zoom features will make it convenient to analyze Protocol in the timing diagram for any timing errors. The protocol window provides the decoded packet information in each state and all packet details with error info in the packet. The selected frame in the Protocol listing window will be autocorrelated in the timing view to view the timing information of the packet.
Setup View
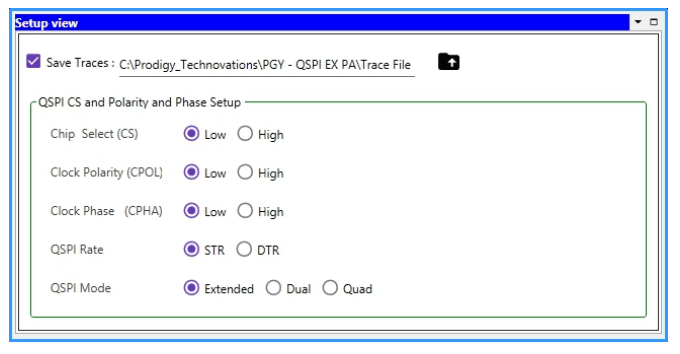
Setup View of PGY-QSPI-EX-PD allows the user to configure the QSPI chip select (CS), Clock Polarity (CPOL), Clock Phase (CHPA), QSPI rate of STR or DTR, and the different modes of QSPI such as Extended, Dual or Quad.
Warranty
Hardware and software are covered by a one-year warranty. Probes are covered months warranty for all manufacturing defects
Technical Data
Spezifiation | ![]() |
---|---|
Configurable | 1 Master + 1 Slave |
QSPI Traffic Generation | Custom QSPI traffic generation Simulatereal-world network traffic |
SCL Frequency | 100KHz to 80MHz |
Voltage Drive Level | 1,8V & 3,3V |
SCL Duty Cycle variation | 25%, 50% and 75% |
SCL & SDA Delay | User-Defined |
Delay between two messages | User-Defined |
QSPI modes supported | Extended, Dual and Quad |
Transfer rate | STR and DTR |
API Support | Support for Automation of operation using Python |
Supports | QSPI protocol decode |
API Support | Unterstützung für die Automatisierung mit Python |
Protocol Views | QSPI Protokoll Dekodierung |
Protocol Views | Timing Diagram View. Protocol Listing View. Bus-Diagram todisplay Protocol packets with timing diagram plot. |
Protocol Error report | Non-standard frame format |
Capture Duration | Continuous streaming Protocol Data to host HDD/SSD |
Host Connectivity | USB 3.0/2.0 interface |
Possible frequencies
The PGY-QSPI-EX-PD unit will work for Frequencies up to 80MHz only in the below mentioned configurations. This is also subject to the fact that the QSPI Exerciser and Protocol analyzer is connected to the DUT using a board- to board connection.
Master | Slave | Maximale Frequenz | Hinweis |
Internal (Prodigy) | External (Customer) | 80MHz | The QSPI-EX-PD Master can go up to frequencies of 80MHz if the external slave is capable to support the same. (Note:This is subject to the fact that a board-to-board connection is used) |
External (Customer) | Internal (Prodigy) | 80MHz | TheQSPI-EX-PD Slave can go up to frequencies of 80MHz if the external master is capable to support the same. (Note:This is subject to the fact that a board-to-board connection is used) |
External (Customer) | External (Customer) | 48MHz | The QSPI-EX-PD can beused as a sniffer for frequencies up to 48MHz only using our default probe cables. |
Internal (Prodigy) | Internal (Prodigy) | 32MHz | The QSPI-EX-PD can go up to frequencies of 32MHz only in the internal loopback mode |
Documentation
Exerciser - Analyzer
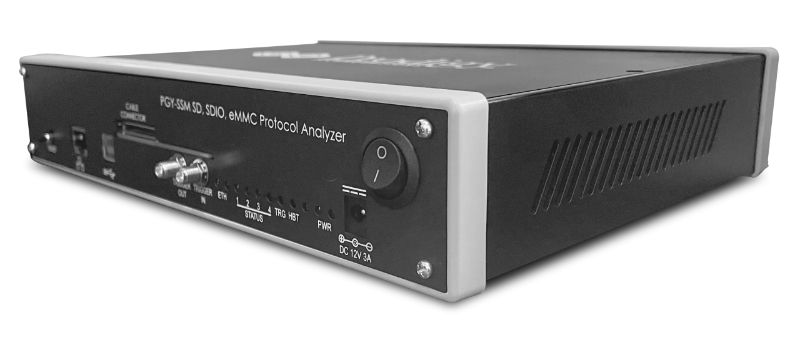
Features eMMC Protocol Analyzer
- Continuous monitoring of protocol data for a long time to capture elusive events (more than 30GB data capture)
- Analysis of captured data per standards for protocol integrity, count of data bursts, CMD CRC errors, Response CRC errors, Data CRC errors, Timing Values, and Reserved commands
- Hardware-based protocol-aware trigger capability in real-time enables capturing specific Events. Triggering facility on patterns, commands, or error events.
- Users can identify the anomalies by decoding command and response arguments.
- Analytics feature provides analysis of acquired protocol data by plotting command, response, data, and frequency of operation over acquired time.
- The analytics feature also provides the decoding of device registers for easy analysis.
- Filters allow you to view specific packets in decoded protocol packets.
- Search feature for specific events in protocol activity.
- Easy-to-use user interfaces save time on the learning curve.
- Handles long-duration capture and displays the decoded data without demanding extensive resources in the host computer.
- Inserting markers [using Trigger-In] in protocol activity helps in correlating the input digital signal with Protocol Activity.
- Trigger-out signal for any specific protocol event allows triggering of other instruments such as an oscilloscope.
- Interface to host system [running UI] using USB3.0 or Gigabit Ethernet interface.
- Flexibility to upgrade the hardware firmware using the GbE interface provides easy field up-gradation of the firmware.
- Export of Decoded data packets to txt file for further analysis.
Price on request
Features UFS 3.1 Protocol Analyzer
- Supports version MPHY 4.0, UniPro 1.8, and UFS version 2.1/3.1
- Supports PWM G1 to G7 and HS G1,2,3,4 A and B Series · Supports one/two data lanes (2 TX and 2 RX)
- Flexibility to capture very large data using continuous streaming of Protocol data to host computer
- Hardware-based circular buffer
- Flexibility to decode selected data from 8GB Buffer
- Solder down active probe provides high signal fidelity
- Decoding at MPHY, UniPro, and UFS layer
- Trigger-based on MPHY, UniPro, UFS layer packet content
- Supports triggering in PWM and HS data rate speeds
- Trigger out a signal at the trigger event allows the triggering of other instruments such as oscilloscope
- Interface to host system using USB 3.0 or Gigabit Ethernet Interface
- Flexibility to upgrade the hardware firmware using the GbE interface provides easy field up-gradation of FPGA firmware
- Decoded data packets can be exported to a text file for further analysis
- PGY-UFS 3.0-PA Protocol Analyzer is lightweight and can be deployed for on-site/ field tests
Price on request
Features UFS 4.0 Protocol Analyzer
- Supports version MPHY 5.0, UniPro 2.0, and UFS v2.1/3.1/4.0
- Supports PWM G1 to G7 and HS G1, 2, 3, 4, 5 Rate A and B Series
- Supports one/two data lanes (2 TX and 2 RX)
- Flexibility to capture very large data using continuous streaming of Protocol data to host computer with 16GB Internal acquisition memory field upgradeable up to 64GB.
- Hardware-based resizable circular buffer with pre/post-trigger.
- Flexibility to decode selected data from a 16GB buffer.
- Solder down active probe provides high signal fidelity.
- Decoding at MPHY, UniPro, and UFS layers.
- Trigger-based on MPHY, UniPro, and UFS layers packet content.
- Trigger out a signal at the trigger event allows the triggering of other instruments such as an oscilloscope.
- Interface to host system using USB 3.0.
- Flexibility to upgrade the hardware firmware using the GbE interface provides easy field up-gradation of FPGA firmware.
- Decoded data packets can be exported to a text file for further analysis.
- Lightweight and can be deployed for on-site/ field tests.
Price on request
Features QSPI Protocol Exerciser and Analyzer
- Supports QSPI speeds of up to 80MHz*
- Ability to configure it as Master or Slave
- Simultaneously generate QSPI traffic and Protocol decode of the Bus
- QSPI Master and Slaves
- STR and DTR Transfer rates
- Extended, Dual, and Quad QSPI Modes Supported
- Variable QSPI data speeds and duty cycle
- Continuous streaming of protocol data to the host computer to provide a large buffer in sniffer mode
- The timing diagram of the protocol decoded bus
- Listing view of Protocol activity
- Error Analysis in Protocol Decode
- Ability to write exerciser script to combine multiple data frame generation at different data speeds
- USB 2.0/3.0 host computer interface
- API support for automation in Python or C++
Price on request
Features SD Protocol Analyzer
- Continuous monitoring of protocol data for a long time to capture elusive events (more than 30GB data capture)
- Analysis of captured data per standards for protocol integrity, count of data bursts, CMD CRC errors, Response CRC errors, Data CRC errors, Timing Values, and Reserved commands
- Hardware-based protocol-aware trigger capability in real-time enables capturing specific Events. Triggering facility on patterns, commands, or error events.
- Users can identify the anomalies by decoding command and response arguments.
- Analytics feature provides analysis of acquired protocol data by plotting command, response, data, and frequency of operation over acquired time.
- The analytics feature also provides the decoding of device registers for easy analysis.
- Filters allow you to view specific packets in decoded protocol packets.
- Search feature for specific events in protocol activity.
- Easy-to-use user interfaces save time on the learning curve.
- Handles long-duration capture and displays the decoded data without demanding extensive resources in the host computer.
- Inserting markers [using Trigger-In] in protocol activity helps in correlating the input digital signal with Protocol Activity.
- Trigger-out signal for any specific protocol event allows triggering of other instruments such as an oscilloscope.
- Interface to host system [running UI] using USB3.0 or Gigabit Ethernet interface.
- Flexibility to upgrade the hardware firmware using the GbE interface provides easy field up-gradation of the firmware.
- Export of Decoded data packets to txt file for further analysis.
Price on request
Features SD/SDIO/eMMC Protocol Analyzer
- Continuous monitoring of protocol data for a long time to capture elusive events (more than 30GB data capture)
- Analysis of captured data per standards for protocol integrity, count of data bursts, CMD CRC errors, Response CRC errors, Data CRC errors, Timing Values, and Reserved commands
- Hardware-based protocol-aware trigger capability in real-time enables capturing specific Events. Triggering facility on patterns, commands, or error events.
- Users can identify the anomalies by decoding command and response arguments.
- Analytics feature provides analysis of acquired protocol data by plotting command, response, data, and frequency of operation over acquired time.
- The analytics feature also provides the decoding of device registers for easy analysis.
- Filters allow you to view specific packets in decoded protocol packets.
- Search feature for specific events in protocol activity.
- Easy-to-use user interfaces save time on the learning curve.
- Handles long-duration capture and displays the decoded data without demanding extensive resources in the host computer.
- Inserting markers [using Trigger-In] in protocol activity helps in correlating the input digital signal with Protocol Activity.
- Trigger-out signal for any specific protocol event allows triggering of other instruments such as an oscilloscope.
- Interface to host system [running UI] using USB3.0 or Gigabit Ethernet interface.
- Flexibility to upgrade the hardware firmware using the GbE interface provides easy field up-gradation of the firmware.
- Export of Decoded data packets to txt file for further analysis.
Price on request
Features SDIO Protocol Analyzer
- Continuous monitoring of protocol data for a long time to capture elusive events (more than 30GB data capture)
- Analysis of captured data per standards for protocol integrity, count of data bursts, CMD CRC errors, Response CRC errors, Data CRC errors, Timing Values, and Reserved commands
- Hardware-based protocol-aware trigger capability in real-time enables capturing specific Events. Triggering facility on patterns, commands, or error events.
- Users can identify the anomalies by decoding command and response arguments.
- Analytics feature provides analysis of acquired protocol data by plotting command, response, data, and frequency of operation over acquired time.
- The analytics feature also provides the decoding of device registers for easy analysis.
- Filters allow you to view specific packets in decoded protocol packets.
- Search feature for specific events in protocol activity.
- Easy-to-use user interfaces save time on the learning curve.
- Handles long-duration capture and displays the decoded data without demanding extensive resources in the host computer.
- Inserting markers [using Trigger-In] in protocol activity helps in correlating the input digital signal with Protocol Activity.
- Trigger-out signal for any specific protocol event allows triggering of other instruments such as an oscilloscope.
- Interface to host system [running UI] using USB3.0 or Gigabit Ethernet interface.
- Flexibility to upgrade the hardware firmware using the GbE interface provides easy field up-gradation of the firmware.
- Export of Decoded data packets to txt file for further analysis.
Price on request