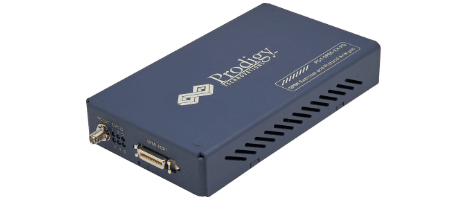
Description
PGY-SE Signal Explorer software is an efficient offline signal analysis tool that runs in any Windows-based system. It provides offline oscilloscope capabilities in the computer. It quickly enables signal analysis by showing time domain plots with powerful zoom features, electrical measurements, and responsive performance for signals captured in long record lengths.
Features Signal Explorer Software
- Offline time-domain analysis of signals captured by the oscilloscope
- No oscilloscope hardware dependency while analyzing signals
- Efficient debugging options for design and validation engineers
- Easy to use for analyzing long record length data
- Easy analysis of signals and protocol problems with support for protocol decode
- Trend plot provides deep insight into signals
- Correlating trend plot data to the time domain improves analysis capability
- Powerful zoom capability enhances the search for the anomaly in waveforms
- Convenient cursor-based measurements with vertical and horizontal cursors
Software View
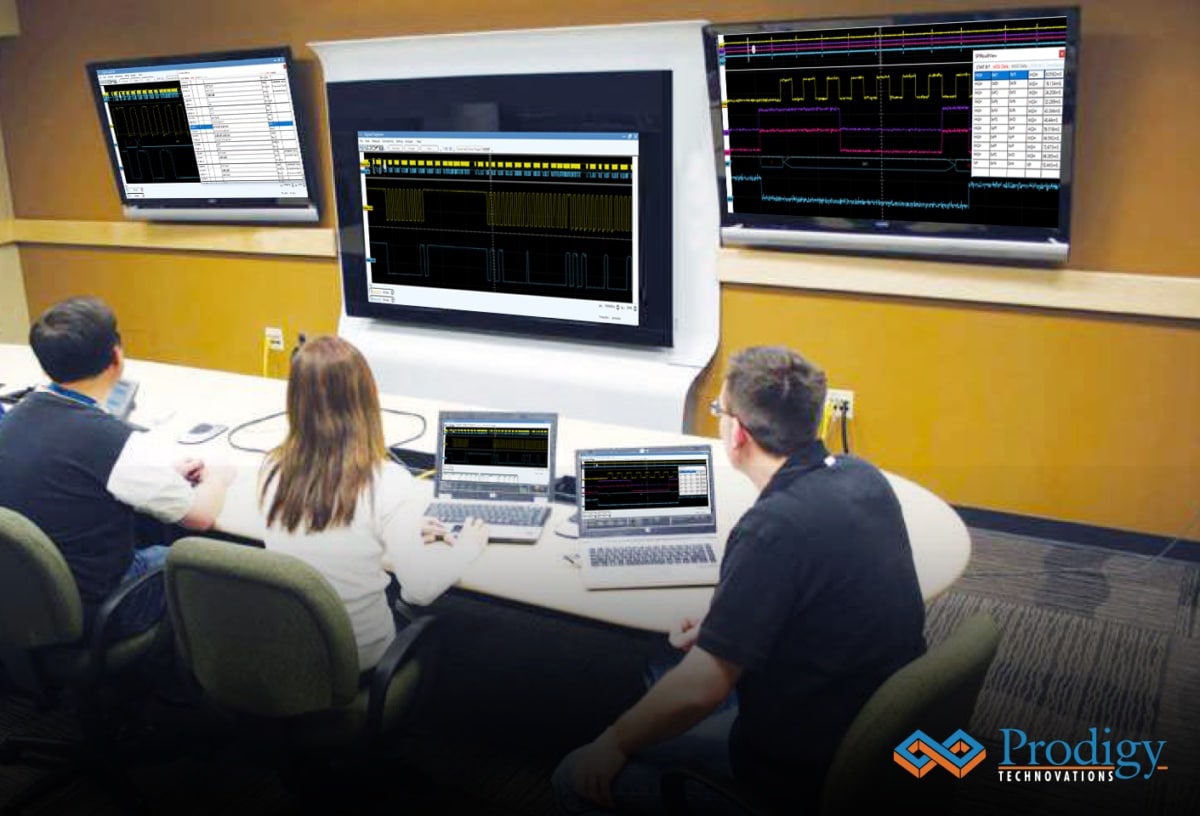
The industry’s first software that creates an integrated trend plot of measurements makes PGY-SE the most suitable tool for debugging designs. Correlating the trend plot data to the time domain plot using markers makes it easy to use. Long record length data can be easily analyzed by zooming to specific sections of the signal in the long memory. The trend plot of electrical measurements enables viewing deviations in any electrical parameter in the acquired data.
The marker placements to correlate trend plot data points to the time domain plot reduces debug time and identifies signal anomalies in the signal with ease. Standard protocol decoding capabilities for I2C, SPI, as standard features allow the analysis of signals for protocol problems in design. The bus diagram and list view then correlate the protocol layer info to the Physical layer to isolate the design problems.
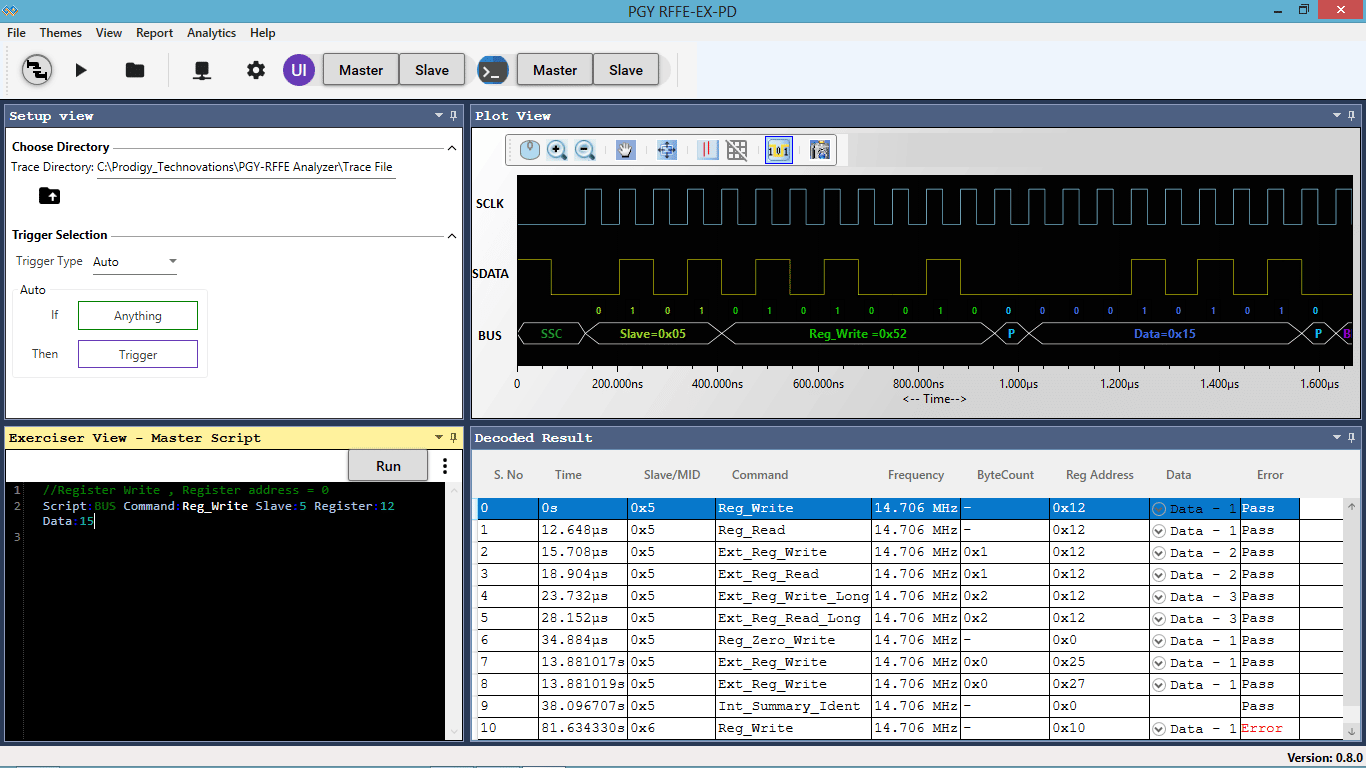
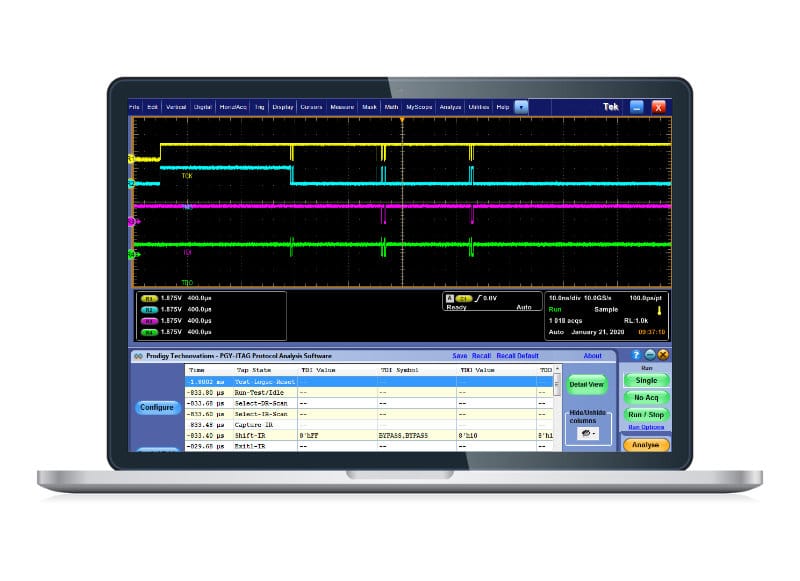
PGY-SE software displays the waveform plot, the zoomed-in waveform plot, and the trend plot of selected measurement in a single view. Markers help in correlating the measurement in the trend plot to the zoomed waveform and the normal waveform plot. Vertical and horizontal cursors provide cursor readouts. Simultaneous views of the entire waveform, zoomed-in waveform, and trend plot ease debugging.
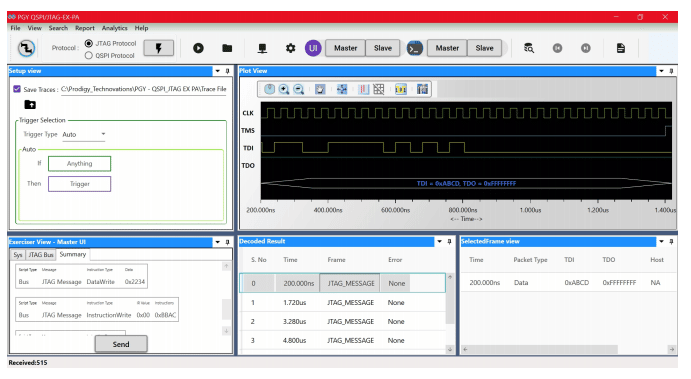
The software provides protocol decoding for I2C, SPI interface as a standard feature. Decoded data is displayed in a table along with errors in the protocol (if any). A bus diagram displays the decoded messages next to the waveform for easy analysis. In a file of long record length, it is possible to zoom in to any waveform area to view information in deta






.jpg)
.jpg)
.jpg)
.jpg)

