




PRACTICAL KNOWLEDGE
What is a logic analyzer?
A logic analyzer is an electronic measuring device that can characterize and graphically display digital signals over time.
Read article
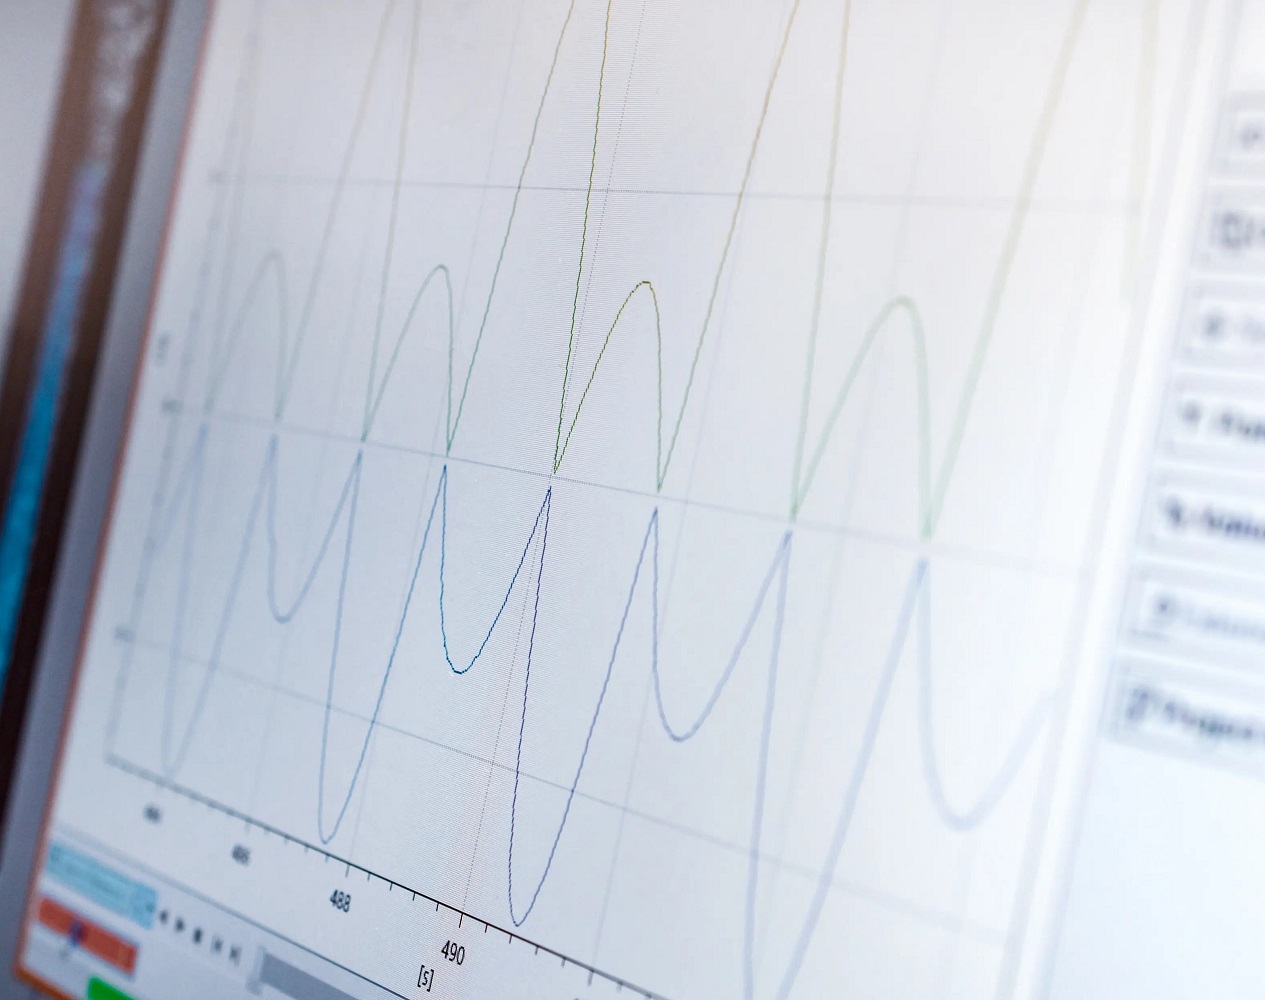
Averaging the signal curve can be a useful way to reduce the noise in a particular signal.
The SIGLENT SDS series of oscilloscopes can easily capture average waveform data using the EasyScope X software.
NOTE: Currently, average waveform data can not be saved in CSV format to a USB memory stick through the front USB connection.
1. Connect the oscilloscope to the computer using a USB or LAN connection and switch it on.
NOTE: This example uses a USB connection for communication between the oscilloscope and the computer.
2. Open EasyScopeX by clicking on the desktop icon:

3. Add the device and select the session address for the instrument you want to connect:

4. Configure the instrument to acquire the signal to be measured. You can do this manually on the control panel or use the Virtual Panel control.
Select Virtual Panel> Acquire> and press the Acquisition button until Type=Average is set:

5. Select "Waveform" and use the Play/Pause button to capture the waveform you want. Then select Save > Select the channel you want > Select the CSV type to save > Press Save to open a file dialog.


CONTINUE EXPLORING
PRACTICAL KNOWLEDGE
A logic analyzer is an electronic measuring device that can characterize and graphically display digital signals over time.
Read articlePRACTICAL KNOWLEDGE
A resolver is an electromagnetic sensor that determines the angle and speed of waves and axes.
Read articlePRACTICAL KNOWLEDGE
Numerous testing and measurement applications require data acquisition over a long period of time.
Read articleFROM READING TO YOUR PROJECT
Describe your signal, interface or test objective. Our team can help you assess the equipment and next steps.