


€1,599.00 Net
€1,902.81 incl. VAT
Delivery time: 2 weeks
.jpg)
.jpg)
.jpg)
.jpg)
Description
PGY-LA-EMBD is an industry-first logic analyzer in its category which enables engineers to debug timing problems and perform simultaneous protocol analysis of I2C, SPI, UART, I3C, SPMI, CAN/CAN FD, and RFFE in embedded designs. This enables designers to debug circuit-level and system-level problems quickly.
PGY-LA-EMBD offers 1GS/Sec asynchronous (timing) data and 100Mhz synchronous (state) data capture which makes it an ideal debug tool to address digital design problems. Designers can now easily analyze setup and hold time issues, glitches, and synchronous data activities apart from analyzing protocol issues.
Current generation embedded designers need to collect data from multiple interfaces such as I2C, SPI, UART, I3C, SPMI, CAN/CAN FD, and RFFE and process it to achieve optimal performance of their designs. Embedded design teams need to take timely action to meet the intended objectives of the product. PGY-LA-EMBD simultaneously decodes I2C, SPI, UART, I3C, SPMI, CAN/CAN FD, and RFFE bus and displays the protocol activity with timestamp information. PGY-LA-EMBD is an ideal instrument to debug hardware and embedded software integration issues and optimize software performance.
Multiple markers enable smart delta measurements which are key to designers. Zoom enables users to look at specific areas of the signal.
Features Logic Analyzer
- 16 channels with Protocol and Logic Analysis capability.
- 1GS/Sec Timing (Asynchronous) Analysis
- 100MHz State (Synchronous) Analysis
- Simultaneous Protocol Analysis of I2C- SPI-UART-I3C-SPMI, CAN/CAN FD, and RFFE.
- Detailed Trigger capabilities: Auto, Pattern, Protocol awareness (I2C, SPI, UART, I3C, SPMI, CAN/CAN FD, RFFE), and Timing (Pulse Width and Delay Trigger).
- Smart streaming of data from Protocol. Analyzer to host computer for long-duration capture using USB3.0 interface.
- Innovative easy-to-use Graphic user interface.
- Error Analysis of Protocol packet
- Provides timing, waveform, listing, and Protocol listing views
- Detailed filtering capability for protocol-decoded data
- PDF and CSV report format.
- API support.
Easy Configuration

Users can easily configure the Logic Analyzer for embedded interfaces by either selecting Logic Analysis(LA) mode or Protocol Analysis (PA) mode or a combined (LA+PA) mode. This ensures a quick and easy way to configure the product and look at complex problems at the system level either in Logic Analysis (State Analysis, Timing Analysis), or Protocol decoding, or both. Save and Recall capability ensures designers can recall their custom setup details.
Multiple domain Views provide the necessary complete view of all supported interfaces’ state, timing and protocol activity. Users can easily set up the analyzer to view timing, logic, and protocol decode views to enable easy insights into the design. Users can set different trigger conditions from the setup menu to capture timing and protocol activity at specific events. The decoded results can be viewed in the timing, logic, and protocol listing window with autocorrelation. This comprehensive view of information makes it the industry’s best, offering an easy-to-use solution to debug the embedded interfaces protocol activity and analyze timing issues. Multiple cursors help designers to look into details of their design performance.
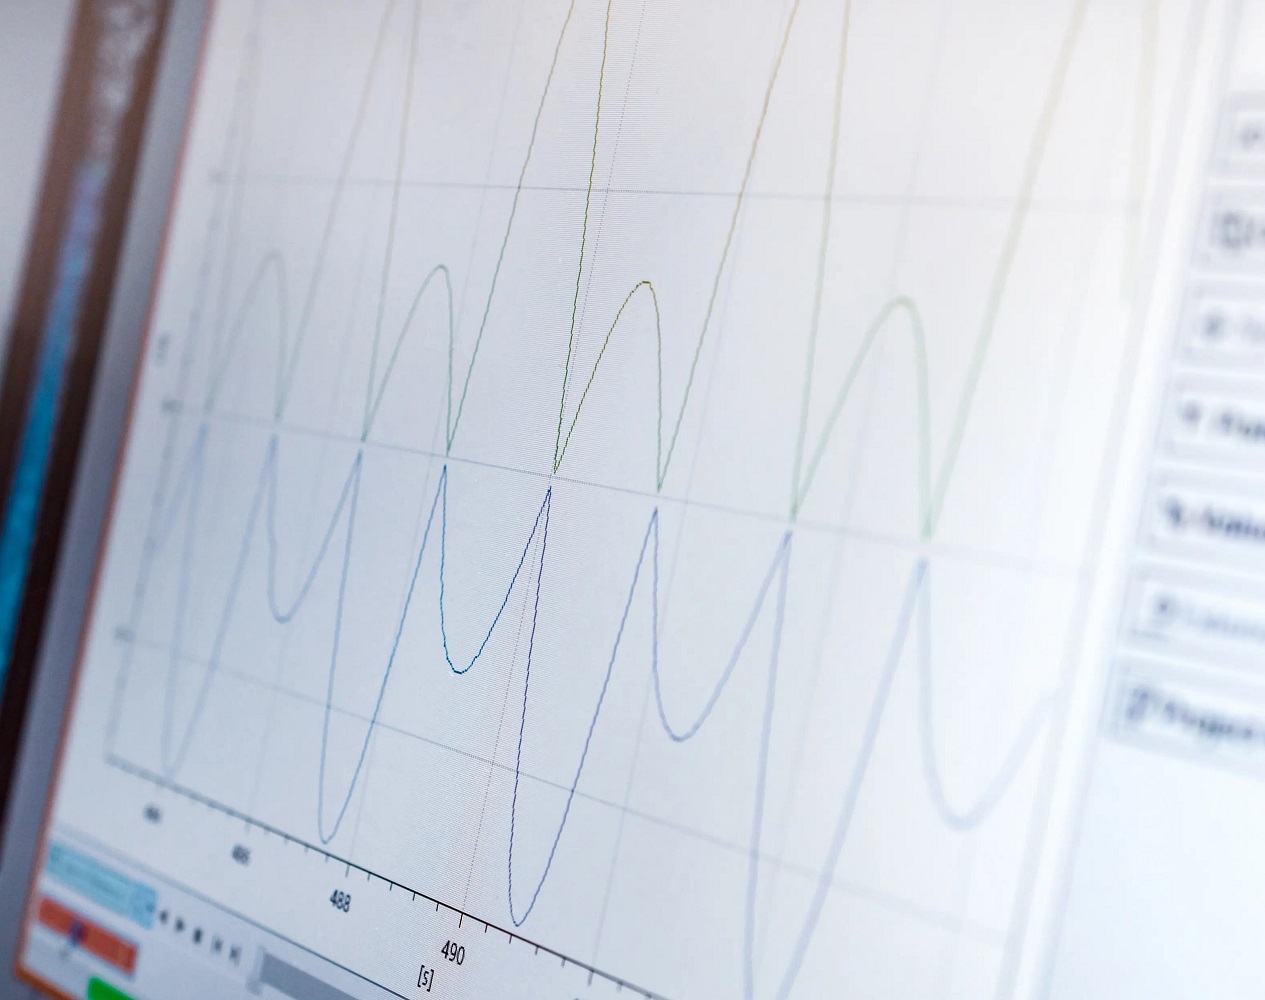
Timing View
Timing view is a unique capability of the PGY-LA-EMBD which enables designers to get detailed insights into their signals’ timing information. The timing view uses an internal clock signal to plot the waveform. The flexible sampling rate selection enables designers to investigate Glitches that can cause issues in the functioning of their designs. The grouping feature enables designers to group various related signals for better viewing and analysis. Marker and Zoom features make it convenient to analyze any timing errors. The ability to analyze any point in the captured data record ensures easy debugging and analysis over a long capture duration.

State View/Waveform Listing View

Protocol Decode View
The protocol Activity window provides the decoded packet information in each state and all packet details with error info in the packets. This gives system-level insight to the design teams. The individual protocol decodes windows based on selected interfaces ensuring easy viewability for design teams. The selected frame in the Protocol listing window will be autocorrelated in the timing view to view the timing information of the packet. Protocol errors will be highlighted to ensure designers are alerted to the same easily.

Powerful Trigger Capabilities
Report
The report can be generated in PDF or CSV format with details of all the signal information, plots, and custom details like the name of the company, logo, tester name, date, and time to ensure designers can document all details and share the report.

Warranty
Hardware and software are covered by a one-year warranty. Probes are covered by a three-month warranty for all manufacturing defects
Technical Data
| Specification |  |
|---|---|
| No of Channels | 16 Logic Channels |
| State Speed | 1GS/s (Asynchronous Capture) |
| Timing Speed | Solder Down Active Probes |
| Number of state clock support | Two, Flexibility to sample on rising or falling edge |
| Record Length | Smart Continuous streaming of data to HDD/SSD of host computer |
| Voltage Level Support | 0 to 5V with Flexibility to define logic threshold |
| Waveform Plot | Plots waveforms with flexible configurable bus diagram |
| Listing View | List all the data samples at each sampling point |
| Trigger for LA | Pattern Trigger, Pulse width trigger, Delay trigger |
| Protocol Decode Support | I2C, SPI, UART, I3C, SPMI, CAN/CAN FD, RFFE |
| Simultaneous decoding of I2C, SPI, UART | Yes, Connect I2C, SPI and UART bus to Logic Analyzer. Simultaneously captures the bus data and displays it in time correlated view with corresponding time waveforms. |
| Protocol View with timing view (PA+LA) | Displays the protocol decoded data with high sample rate and timing waveform at the same time |
| API Support | Support for Automation of Operation using Python and C++ |
| Connector type | Flying Lead Probe with Female Connectors #16 Micro Grabber Test Clips as Optional Accessories |
| External Triggers | Trigger Out SMA Connector |
| Markers | Six, with delta information between two markers. |
| Views | Timing View State/Logic/Waveform Listing View Protocol View Bus-Diagram to display Protocol packets with timing diagram plot Auto Trigger – Default (Trigger on any packet) |
| Protocol Trigger | Pattern Trigger Protocol Aware Trigger- UART: Start bit, Parity Bit, Data SPI: MOSI Data, MISO data I2C: START bit, Address, Data, Address plus Data, ACK, NACK, Repeated START, STOP bit Timing parameter trigger: Pulse width (Positive or Negative) Delay Trigger. |
| Capture duration | Smart streaming of Protocol Data to host HDD/SSD. |
| Report | Report Generation in PDF and CSV format |
| Host Connectivity | USB 3.0 Type-C |
| Dimensions | 115mmx90mmx25mm |
| Weight | 300g |
Documentation
Exerciser - Analyzer


")


 Protocol Exerciser & Analysator")


